@arvindkelvin,
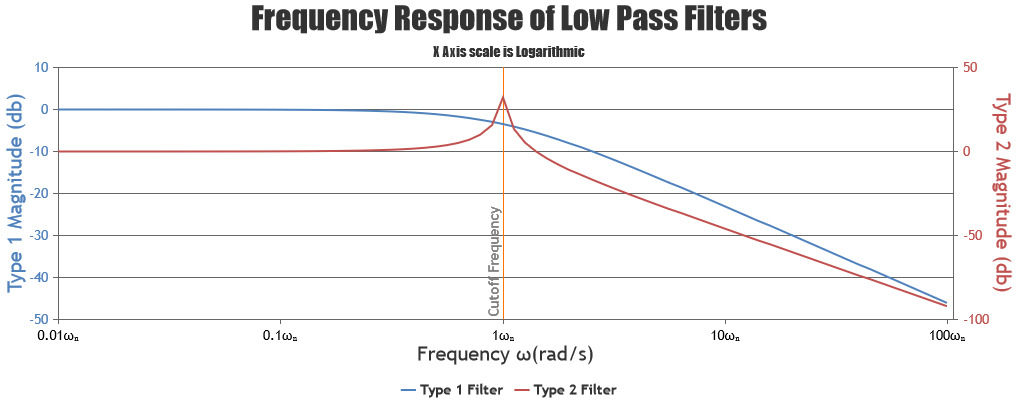
You can show legend for each dataseries by setting showInLegend property. Please take a look at this documentation page for more information on legend & its customization options.
However, if you are looking to display some information within each column of the column chart, you can use index labels
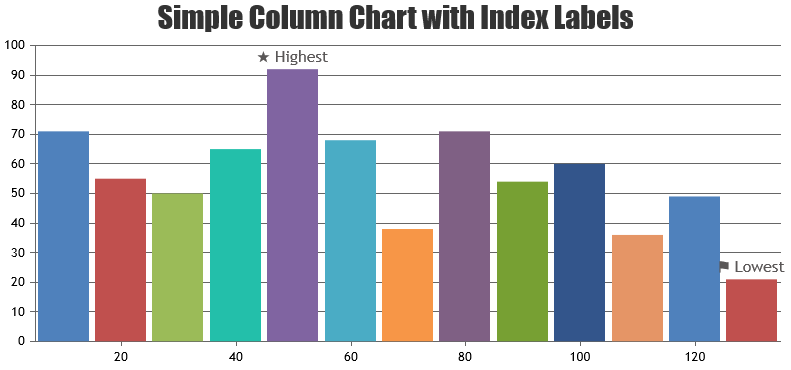
—
Adithya Menon
Team CanvasJS