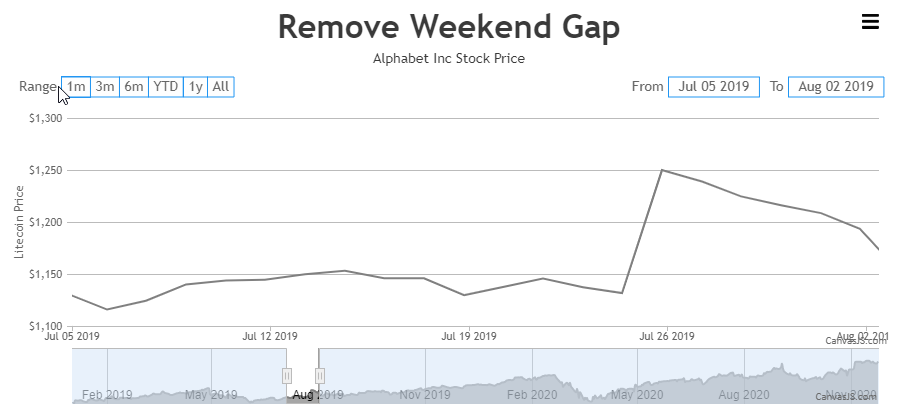
This is an odd case, I know. But…
I would like to have a chart with multiple series, but, the X axis for each series is a different set of values. In my example: Series1 is ‘May, June, July, Aug’, and Series 2 is ‘Jan, Feb, Mar, April’. The chart displays fine with both series, but the X axis only shows the first series in the array (may-aug).
Believe me, due to the nature of the data I want to compare, the timeframes are different. I have thought about doing 2 charts, one for each series, stacked on top of each other. But, in the real world that won’t work as my data is dynamic, and I may have 1 series the first time, 5 series the next, etc.
Here is a simple example:
https://jsfiddle.net/canvasjs/QwZuf/#&togetherjs=DS5E2OUTkx
Not sure if this is a bug, a feature add ask, or just plain impossible with the way the chart code works.
Thanks
JE
