Login to Ask a Question or Reply
Home › Forums › Chart Support › How to hide data or label when the value is 0 › Reply To: How to hide data or label when the value is 0
July 27, 2018 at 12:09 pm
#22002
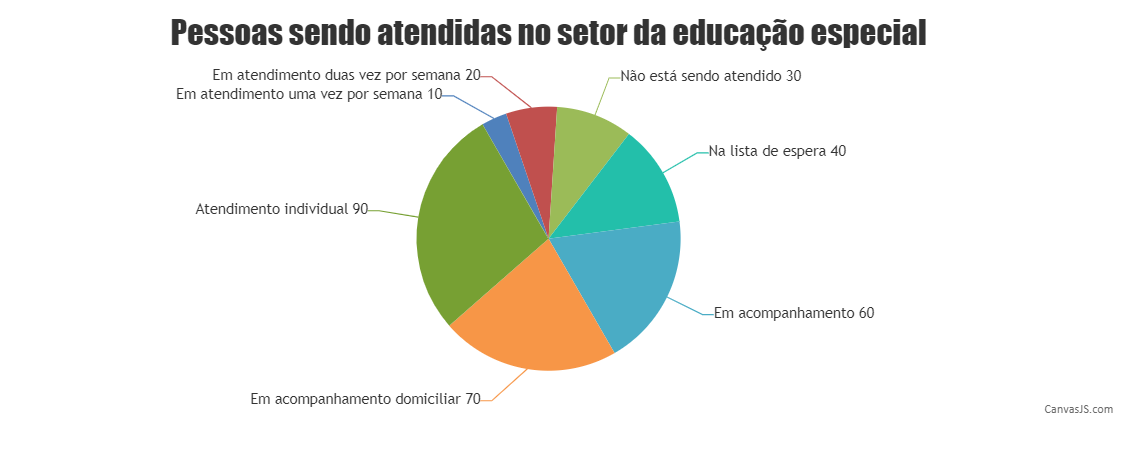
While you are updating the indexLabel of dataPoints with y-value 0 or null, you can also set the indexLabelLineThickness to 0 so that they are not displayed on the pie chart. The code snippet below shows how you can achieve the same:
function hideIndexLabel() {
  var length = chart.options.data[0].dataPoints.length;
  for(var i = 0; i < length; i++ ) {
    if( chart.options.data[0].dataPoints[i].y === 0  || chart.options.data[0].dataPoints[i].y === null ) {
      chart.options.data[0].dataPoints[i].indexLabel = " ";
      chart.options.data[0].dataPoints[i].indexLabelLineThickness = 0;
    }
    else
      chart.options.data[0].dataPoints[i].indexLabel = chart.options.data[0].dataPoints[i].indexLabel;
  }
}
Please take a look at this updated sample project for a working example with sample code.
__
Priyanka M S
Team CanvasJS