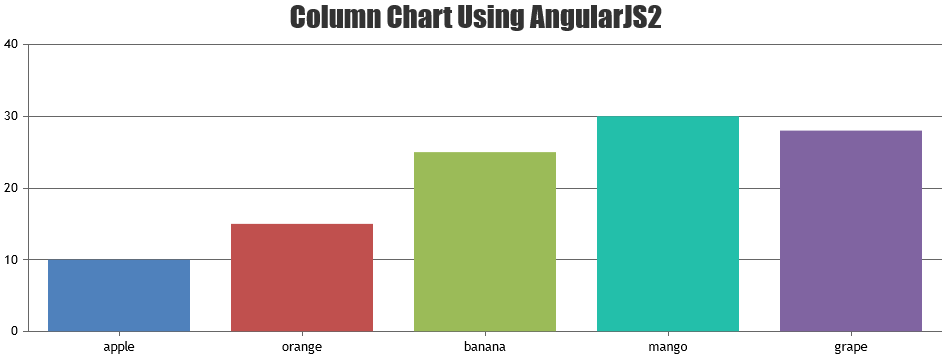
How do I create a simple chart in Angular 2?
I imported the canvasjs.min.js file using: import * as CanvasJS from ‘path to canvasjs.min.js’
I set up a div container like: <div #chartContainer style=”height: 370px; width: 100%;”></div>
and in the .ts file, I created a @ViewChild like: @ViewChild(‘chartContainer’) canvasChart; (also tried with :ElementRef)
and create the chart in ngOnInit (I also tried doing this after ngAfterViewInit):
ngAfterViewInit() {
const chart = new CanvasJS.Chart(this.canvasChart, {
animationEnabled: true,
exportEnabled: true,
title: {
text: ‘Basic Column Chart in Angular’
},
data: [{
type: ‘column’,
dataPoints: [
{y: 71, label: ‘Apple’},
{y: 55, label: ‘Mango’},
{y: 50, label: ‘Orange’},
{y: 65, label: ‘Banana’},
{y: 95, label: ‘Pineapple’},
{y: 68, label: ‘Pears’},
{y: 28, label: ‘Grapes’},
{y: 34, label: ‘Lychee’},
{y: 14, label: ‘Jackfruit’}
]
}]
});
chart.render();
}
But I get this error when I load the page:
ERROR TypeError: this.container.appendChild is not a function
at new s (canvasjs.min.js:113)
at DeviceGraphPageComponent.push../src/app/device-graph-page/device-graph-page.component.ts.DeviceGraphPageComponent.ngAfterViewInit (device-graph-page.component.ts:328)
at callProviderLifecycles (core.js:10414)
at callElementProvidersLifecycles (core.js:10388)
at callLifecycleHooksChildrenFirst (core.js:10378)
at checkAndUpdateView (core.js:11316)
at callViewAction (core.js:11548)
at execEmbeddedViewsAction (core.js:11511)
at checkAndUpdateView (core.js:11308)
at callViewAction (core.js:11548)
Can someone help me out with getting the chart to work in Angular 2?
Thanks!
