Login to Ask a Question or Reply
Home › Forums › Chart Support › The ‘0’ on X-axis doesn’t start from the origin › Reply To: The ‘0’ on X-axis doesn’t start from the origin
June 15, 2018 at 12:18 pm
#21117
Nirmalya,
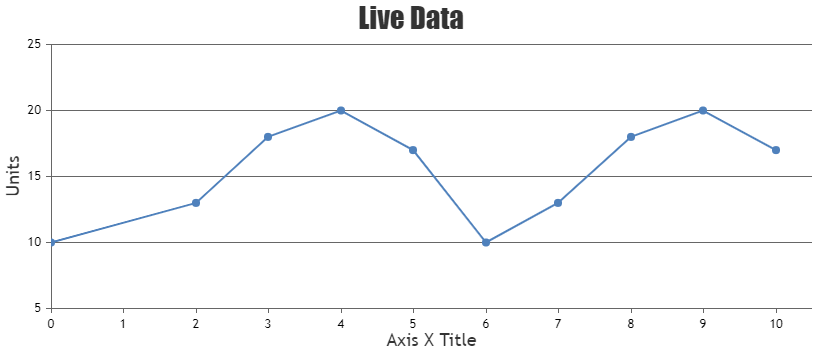
Axis-X does not start from 0 (zero) because of the auto-calculated axis minimum. However, it is possible to begin Axis-X from 0 by setting axis minimum to 0 and resetting it by setting it to null while updating the chart. Please take a look at the code snippet below for the same.
var chart = new CanvasJS.Chart("chartContainer",{
  title :{
    text: "Live Data"
  },
  exportEnabled: true,
  axisX: {
    title: "Axis X Title",
    minimum: 0
  },
  axisY: {
    title: "Units"
  },
  data: [{
    type: "line",
    dataPoints : dps
  }]
});

chart.render();
var xVal = dps.length + 1;
var yVal = 15;
var updateInterval = 10000;
var updateChart = function () {
  chart.options.axisX.minimum = null;
  yVal = yVal + Math.round(5 + Math.random() *(-5-5));
  dps.push({x: xVal,y: yVal});

  xVal++;
  if (dps.length > 10 )
  {
    dps.shift();
  }

  chart.render();
};

setInterval(function(){updateChart()}, updateInterval);
Also, have a look at this JSFiddle for complete working code.
__
Priyanka M S
Team CanvasJS