@netpresent,
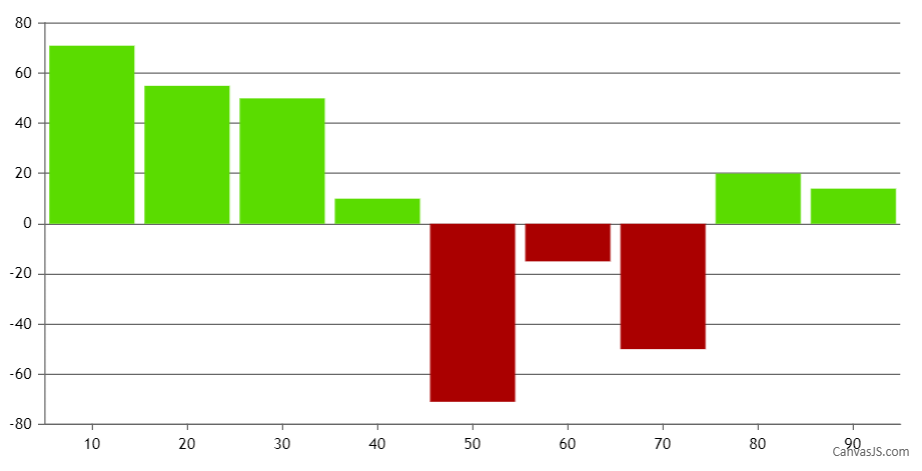
Yes, column/bar chart should work fine without introducing new dataPoint in this scenario. However, you need to set dataPoint color based on its value, whether negative or positive as shown in the below code snippet –
function setColor(chart){
	for(var i = 0; i < chart.options.data.length; i++) {
  	dataSeries = chart.options.data[i];
  	for(var j = 0; j < dataSeries.dataPoints.length; j++){
    	if(dataSeries.dataPoints[j].y <= 0)
      	dataSeries.dataPoints[j].color = 'rgb(170, 0, 0)';
    }
  }
}
Please take a look at this JSFiddle for a working example.

___________
Indranil Deo
Team CanvasJS