Login to Ask a Question or Reply
Home › Forums › Chart Support › Creating data Tables in charts › Reply To: Creating data Tables in charts
June 23, 2017 at 12:46 pm
#15391
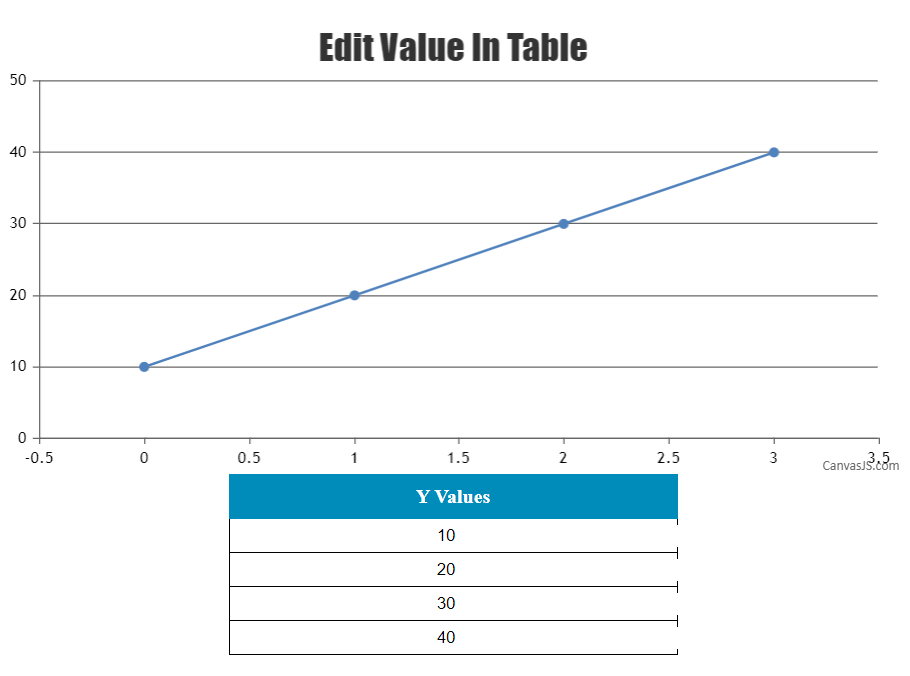
You can easily create a chart using the values from HTML Table data and can also update the dataPoints once the table data is changed as shown in the code snippet below:
document.getElementById('customTable').addEventListener("change", function (e) {
  index = e.target.parentNode.parentNode.rowIndex;

  if (!chart.options.data[0].dataPoints[index - 1])
    chart.options.data[0].dataPoints[index - 1] = {};

  chart.options.data[0].dataPoints[index - 1].y = Number(e.target.value);
  chart.render();
});
Please take a look at this JSFiddle for a working example with sample code on rendering chart from HTML Table data.
___
Suyash Singh
Team CanvasJS