@jyxx,
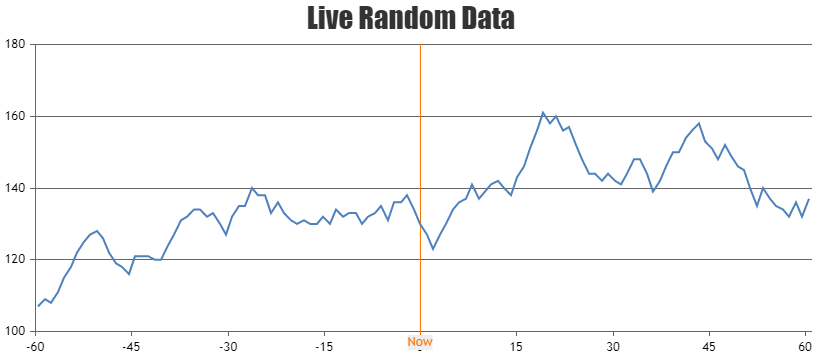
You can create dynamic chart with static x-axis by adding one more axisX and setting it’s stripLines, viewportMinimum and viewportMaximum as per your requirements. Also, you will need to hide the default axisX. Please have a look at below code snippet for axisX properties to be used.
axisX: [{
    tickLength: 0,
    lineThickness: 0,
    labelFormatter: function(e) {
      return "";
    },
    margin: -5
  }, {
    viewportMinimum: -60,
    viewportMaximum: 60,
    interval: 15,
    stripLines: [{
      value: 0,
      label: "Now",
      labelPlacement: "outside"
    }]
  }],
Also, check out this JSFiddle for complete code.

___
Suyash Singh
Team CanvasJS


