Login to Ask a Question or Reply
Home › Forums › Chart Support › Set image as a marker › Reply To: Set image as a marker
March 23, 2017 at 8:32 pm
#14660
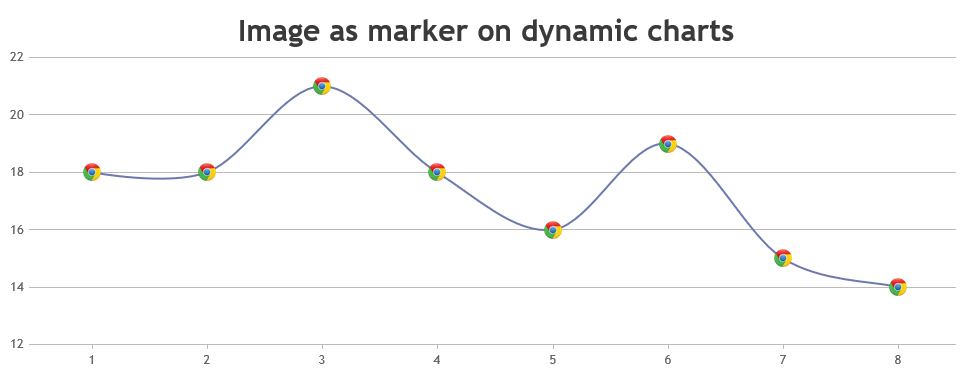
For dynamic data, updating the position of image after adding new dataPoint has to be handled. Please take a look at below code snippet for the same.
var updateChart = function () {
  yVal = yVal + Math.round(5 + Math.random() * (-5 - 5));
  dps.push({ x: xVal,y: yVal });
  xVal++;
  if (dps.length > 10)
  {
    dps.shift();
  }
  chart.render();
  addMarkerImage(chart);
};

function addMarkerImage(chart) {
  var data = chart.options.data[0];
  for(var i = 0; i < data.dataPoints.length; i++) {
    customMarkers.push($("<img>").attr("src", data.markerImageUrl)
                       .css("display", "none")
                       .css("height", 20)
                       .css("width", 20)
                       .appendTo($("#chartContainer>.canvasjs-chart-container"))
                      );
    positionMarkerImage(customMarkers[i], i);
  }
}

function positionMarkerImage(customMarker, index){
  var pixelX = chart.axisX[0].convertValueToPixel(chart.options.data[0].dataPoints[index].x);
  var pixelY = chart.axisY[0].convertValueToPixel(chart.options.data[0].dataPoints[index].y);

  customMarker.css({"position": "absolute",
                    "display": "block",
                    "top": pixelY - customMarker.height()/2,
                    "left": pixelX - customMarker.width()/2
                   });
}

var updateId = setInterval(function () { updateChart();}, updateInterval);
Please refer to this JSFiddle for complete code.
Regarding your query about the Trial Version, our sales team have already mailed you and they will be assisting you further with your requirements.
—
Suyash Singh
Team CanvasJS