You must be logged in to post your query.
Home › Forums › Chart Support › 
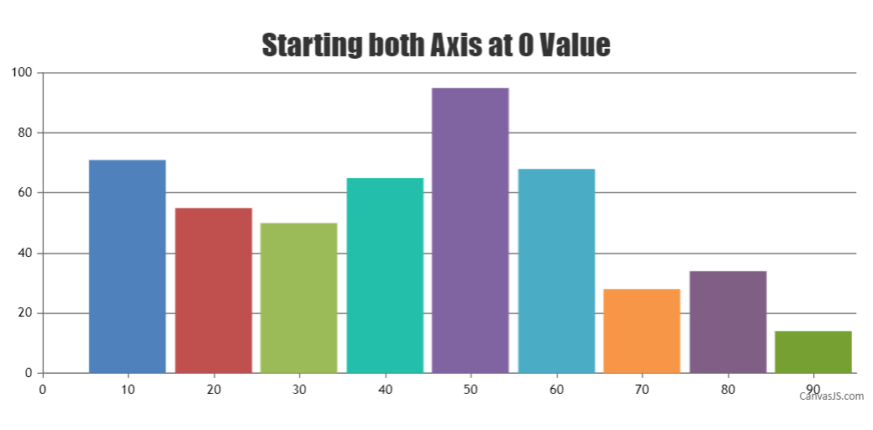
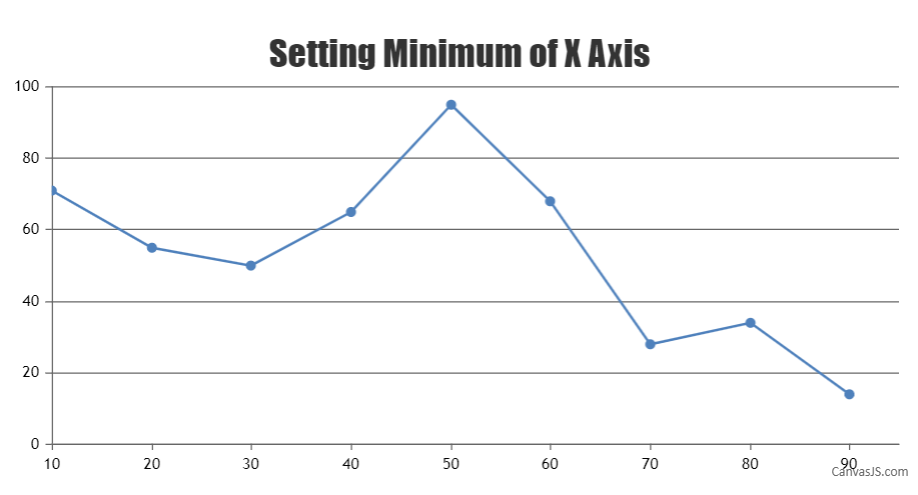
Set XAxis Value to start at 0
Tagged: chart, x-axis, Y Axis Edge
Hey All,
I was wondering if there is a way to set the XAxis and Y Axis to start at 0. Currently they both start at whatever there lowest value is in the dataPoints be that 0, 0.2, 0.5.
Thanks for the help! -Extrabeefy
Extrabeefy,
To start both axis at 0 you can set axisX minimum and axisY minimum to 0 as shown in the code snippet below –
axisX: { minimum: 0 }, axisY: { minimum: 0 },
Also, kindly take a look at this JSFiddle for a complete working code.
Ah ok thank you from the example I figured it meant if I didn’t have a value of 0 then it would show 0.2. Thank you!
Hi,
I have a problem. I need to show a line chart which will always start from the yaxis line edge. That means, i cannot set x: 0, because that will move the data point a little right from the y axis line. A sample is shown in the image. Is there any way i can do this?
@vishnumohan89,
To design a line chart that always starts from y-axis line you can set the minimum of axisX to the x-value of the first dataPoint. Please check the below code snippet –
function setAxisXMinimum(){ chart.axisX[0].set("minimum", chart.options.data[0].dataPoints[0].x); }
Also, kindly take a look at this JSFiddle for complete working code.
___________ Indranil Deo Team CanvasJS
What if I want the bar chart to start from -140 and only rise to the indicated value?
Nevermind. Used a range chart and it works fine.
You must be logged in to reply to this topic. Login/Register