Hi everybody,
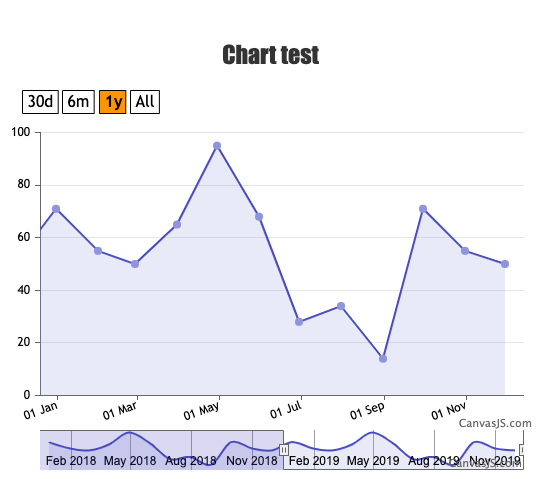
i’m trying to add the zooming feature on the chart i’m developing.
I succeeded, but when zoomEnabled is TRUE i get the 2 buttons (reset and zoom switch) directly on the chart area instead next to the chart title.
In this way there’s a part of chart hidden by those two buttons.
I’ve set the zoomEnabled property on the “chart” sections:
charts: [{
zoomEnabled: true,
zoomType: “x”,
axisX: {
crosshair: {
enabled: true,
snapToDataPoint: true,
valueFormatString: “DD MMM YYYY”
},
labelFormatter: function (e) {
return CanvasJS.formatDate( e.value, “DD MMM”);
},
labelAngle: -20
},
axisY: {
prefix: “”,
suffix: “”,
gridThickness: 1,
gridColor: “#e6e6e6”,
crosshair: {
enabled: true,
snapToDataPoint: true,
valueFormatString: “#,###.000000”,
}
},
because placing everywhere else, the zoom feature doesn’t work.
Have you some tip for me?
