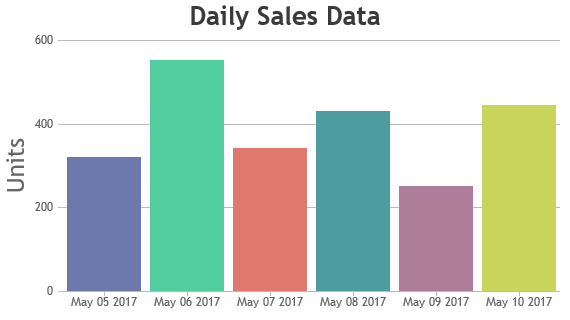
Hi!
I have been following this guide on how to populate the graph with JSON from backend using .getJSON but i keep getting “Uncaught TypeError: $.getJSON is not a function”.
I´m not necessarily partial to any particular solution since i´m pretty new to JS compared to python, so I might have missed something obvious in my code or perhaps a better solution. The data we will be using will be a pretty small dataset with 12 time and value-pairs. I have been trying different solutions for probably two days so i have likely stared myself blind on this. Really thankful for any tips!
This is the code we are using:
$(document).ready(function() {
		var dataPoints = [];
		var chart = new CanvasJS.Chart("chartContainer", {
			animationEnabled: true,
			theme: "light2",
			title: {text: "my chart"},
			axisY: {
				title: "title",
				titleFontSize: 20
			},
			data: [{
				type: "column",
				dataPoints: dataPoints
			}]
		});

		function addData(data) {
			for (var i = 0; i < data.length; i++) {
				dataPoints.push({
					x: (data[i].label),
					y: data[i].y
				});
			}
			chart.render();
		}
		$.getJSON("http:/localhost:8080/mydata.json", addData);
		})
Things i have checked:
- I have tried changing the $ to jQuery as described in https://api.jquery.com/jQuery.getJSON. This only resulted in error “Uncaught TypeError: jQuery.getJSON is not a function”
- I have confirmed the data is reachable in the correct location (http:/localhost:8080/mydata.json)
- Data looks more or less identical to the example data
Data looks like this:
data = [
		{"label": 11, "y": 320},
		{"label": 12, "y": 552},
		{"label": 13, "y": 342},
		{"label": 14, "y": 431},
		{"label": 15, "y": 251},
		{"date": 16, "y": 445}
	]
Thanks in advance!
-Victor
