Login to Ask a Question or Reply
You must be logged in to post your query.
Home › Forums › Chart Support › tooltip for stripline
tooltip for stripline
- This topic has 21 replies, 2 voices, and was last updated 1 year, 7 months ago by
Vishwas R.
-
July 30, 2024 at 2:17 pm #45599
Hello,
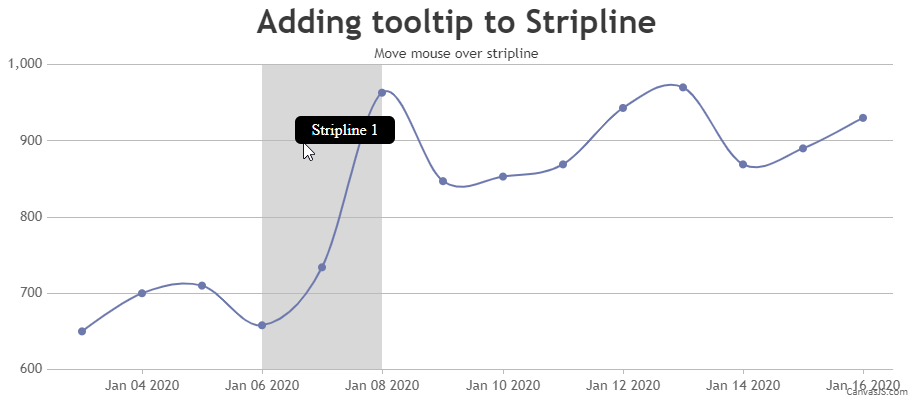
Is it possible to display a tooltip when user hovers over a stripline?
July 30, 2024 at 6:16 pm #45605Showing tooltip to stripline is not available as an inbuilt feature as of now. However, you can show tooltip with few lines of code by adding a div on mouse-move as shown in the code-snippet below.
chart.container.addEventListener("mousemove", function(e) {
  var xPos = e.pageX - this.offsetLeft,
      yPos = e.pageY - this.offsetTop,
      bounds = stripLine.bounds,
      index = stripLine._index;

  if((bounds.x1 <= xPos && xPos <= bounds.x2) && (bounds.y1 <= yPos && yPos <= bounds.y2)) {
    if(document.getElementById("striplineTooltip" + index)) {
      document.getElementById("striplineTooltip" + index).style.display = "block";
      document.getElementById("striplineTooltip" + index).style.left = xPos + "px";
      document.getElementById("striplineTooltip" + index).style.top = yPos + "px";
    }
    else {
      var tooltip = document.createElement("div");
      tooltip.setAttribute("id", "striplineTooltip" + index);
      tooltip.setAttribute("class", "tooltip");
      tooltip.innerHTML = "<div class='tooltiptext'>" + toolTipContent + "</div>";
      this.appendChild(tooltip);
    }
  }
  else {
    if(document.getElementById("striplineTooltip" + index)) {
      document.getElementById("striplineTooltip" + index).style.display = "none";
    }
  }
});
Please take a look at this JSFiddle for a working example on the same.
—
Vishwas R
Team CanvasJSJuly 31, 2024 at 2:19 pm #45611Thank you, is it also possible to add the stripline to the legend? (like dataseries 1 in this example https://jsfiddle.net/api/post/library/pure/) ?
July 31, 2024 at 5:38 pm #45614Legends for striplines are not available as of now. However, you can add a dummy dataseries to show legend for stripline as shown in this updated JSFiddle.
If you are looking for something else, can you kindly fork the JSFiddle and share it with us so that we understand your scenario better & help you out?
—
Vishwas R
Team CanvasJSAugust 6, 2024 at 2:44 pm #45658Do you have the first example you sent using React ?
using CanvasJSChart
-
This reply was modified 1 year, 8 months ago by
SCompliance.
August 7, 2024 at 6:29 pm #45667Please take a look at this Stackblitz link for an example on adding tooltip to Stripline in React, same as JSFiddle shared earlier.
—
Vishwas R
Team CanvasJSAugust 14, 2024 at 5:17 pm #45711https://stackblitz.com/edit/canvasjs-chart-tooltip-to-stripline-dt1nzk?file=src%2FApp.jsx
how to clear them ? if you hover on no data it will still be there
August 19, 2024 at 11:59 am #45741You can add tooltip to Stripline based on length of dataseries as shown in the code-snippet below.
if (chart.data && chart.data.length > 0) {
  addTooltipToStripline(chart.axisX[0].stripLines[0], 'Stripline 1');
}
Please take a look at this updated Stackblitz for complete code.
—
Vishwas R
Team CanvasJSAugust 19, 2024 at 3:45 pm #45742https://stackblitz.com/edit/canvasjs-chart-tooltip-to-stripline-nhtufj?file=src%2FApp.jsx
the tooltip will still be there when I zoom on another area
August 20, 2024 at 5:52 pm #45764Checking if the startValue & endValue lies within the axis range should work fine in this case. Please find the code-snippet for the same below.
stripLine.startValue < stripLine.chart.axisX[0].viewportMaximum && stripLine.endValue > stripLine.chart.axisX[0].viewportMinimumPlease take a look at this updated Stackblitz for working code.
—
Vishwas R
Team CanvasJSAugust 21, 2024 at 7:09 pm #45771it might be in the viewport but moved if you zoomed in on it, it wont work
August 21, 2024 at 8:13 pm #45772One of the issues is that on zoom the tooltips are not moving and are triggered on the old position of the striplines
August 22, 2024 at 5:26 pm #45775Tooltip for stripline is not available as of now. In the current case of zooming / panning, the solution shared earlier can be improved further by checking if the current-mouse coordinate is within the plotarea bounds or not along with existing conditions as shown in the code-snippet below.
xPos >= stripLine.chart.plotArea.x1 && xPos <= stripLine.chart.plotArea.x2 && yPos >= stripLine.chart.plotArea.y1 && yPos <= stripLine.chart.plotArea.y2Please take a look at this updated Stackblitz for working code.
—
Vishwas R
Team CanvasJSAugust 23, 2024 at 1:42 pm #45777thanks, I modified the code to add the tooltipContent from the options but for some reason it’s not working on zoom/panning.
Can you please have a look? https://stackblitz.com/edit/canvasjs-chart-tooltip-to-stripline-qdratg?file=src%2FApp.jsx
August 26, 2024 at 1:14 pm #45789even on window resize the tooltip won’t be placed correctly
-
This reply was modified 1 year, 8 months ago by
You must be logged in to reply to this topic.