Home Forums Chart Support Tabular presentation of graph data

Tabular presentation of graph data

Viewing 6 posts - 1 through 6 (of 6 total)
  • #37551

    Good afternoon dear friends! I ask for your help in the matter. Purpose: Display a tabular view of the graph, the figure shows an example. drive.google.com/file/d/1EE86nQzuITCZRgiW4bP0xdHH5JuNg8-K/view?usp=sharing

    #37571

    @oleglr,

    It is not possible to create a graph in tabular form (based on your screenshot) using CanvasJS as of now. However, with a few lines of code, it is possible to create a table with data from the chart as shown in the code-snippet below,

    function addTable(chart){
    	var tableData = "";
    	for(var i = 0; i < chart.data.length; i++){
      		tableData += "<tr>" + "<td style='color:" + chart.data[i].color + "'>■" + chart.data[i].name + "</td>";
          for(var j = 0; j < chart.data[i].dataPoints.length; j++){
          	tableData += ("<td>" + chart.data[i].dataPoints[j].y +"%</td>")
          }
          tableData += "</tr>";
      }
      $("#chartData").append(tableData)
    }

    Kindly take a look at this JSFiddle for an example on the same.
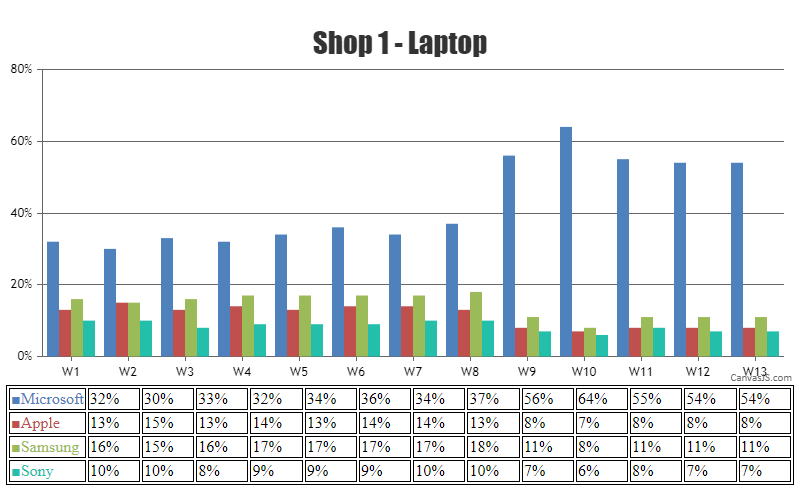
    multiseries column chart with data-table


    Adithya Menon
    Team CanvasJS

    #37575

    Thank you friend! Yes, I took into account this example earlier, but I would like to clarify how to add data from the graph to the cells of the table according to the data that we use to plot. I would be grateful if you could show a similar example.

    #37578

    I would be grateful if you demonstrate the construction of a table according to your solution using https://jsfiddle.net/7rynzbh8/

    #37584

    @oleglr,

    It is possible to create a dynamic table with the data from a dynamic chart as per your requirement. Kindly take a look at the code snippet below,

    $("#chartData tr:first-child").append("<td>" + (color == "red" ? "" : "<span class='blue'>"+yVal+"</span>") +"</td>")
     $("#chartData tr:nth-child(2)").append("<td>"+ (color == "red" ? "<span class='red'>"+yVal+"</span>" : "") +"</td>")

    Please take a look at this updated JSFiddle for an example on the same.


    Adithya Menon
    Team CanvasJS

    #37585

    Thank you from the bottom of my heart for your support my dear friend! You have been of great help to me! I really appreciate your tips, and you as a specialist and a very good person!

Viewing 6 posts - 1 through 6 (of 6 total)

You must be logged in to reply to this topic.