Home Forums StockChart Support StockChart Time Series Toggle

StockChart Time Series Toggle

Viewing 3 posts - 1 through 3 (of 3 total)
  • #60020

    Hello. I’m planning on using the getInstance method with a Bootstrap 5 button to try and toggle between a daily and weekly array of OHLC data, which are dynamically pushed from a database and subsequently an API endpoint. Do you have any documentation on best or recommended practices for toggling between time series data on the chart? Thank you.

    #60035

    @fitted_sheet,

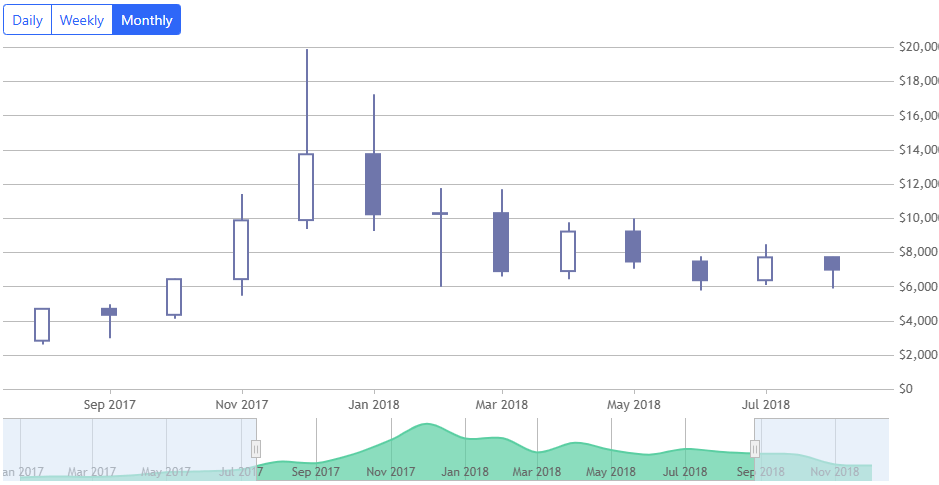
    You can easily load the data from your API endpoint on the click of the button and display loader while requesting data to smoothen the experience. You could also store the data in local variable so that you don’t request same data repeatedly on clicking of button. Please take a look at this JSFiddle for an example on loading daily, weekly, and monthly on click of bootstrap buttons.

    Loading weekly, monthly data on clicking bootstrap button in StockChart

    —-
    Manoj Mohan
    Team CanvasJS

    #60036

    This is great. Your team is so responsive, helpful, and professional. Thank you for the wonderful customer service!

Viewing 3 posts - 1 through 3 (of 3 total)

You must be logged in to reply to this topic.