@bettovenn,
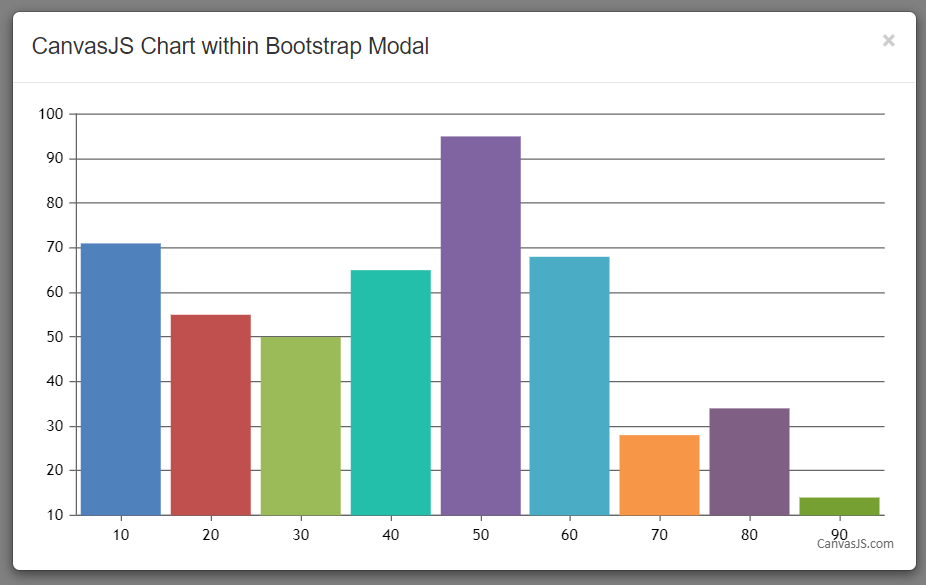
CanvasJS Chart automatically sets the width and height of the chart according to container’s dimensions. When the container’s dimension is not specified it takes up the default width & height(500px X 400px).
Also, in bootstrap, since the modal is not displayed initially, chart takes the default values. To solve this issue, you can render the chart when the shown.bs.modal event is fired.
$('#chartModal').on('shown.bs.modal', function () {
        chart.render();
});
Please take a look at this JSFiddle.
Sachin Bisht
Team CanvasJS
.