Home Forums StockChart Support Showing date in milliseconds for x-axis even if I pass date in correct format

Showing date in milliseconds for x-axis even if I pass date in correct format

Viewing 4 posts - 1 through 4 (of 4 total)
  • #35656

    Hi there,

    I am trying to render scatter graph, its functioning properly when I have datapoints under the response but if I dont have any datapoints i.e. empty datapoints then its showing blank graph with x-axis date in milliseconds.
    Please see below sample json response

    {
    "type": "event-graph",
    "title": "Depression Events Timeline",
    "x-axis-label": "Date",
    "x-axis-min": 1577836800000,
    "x-axis-max": 1631544212365,
    "dataPoints": [
    
    ]
    }

    Also please find both screenshots, with/without datapoints
    1. With datapoint
    https://ibb.co/jWnXHrW
    2. Without datapoint
    https://ibb.co/tpjzswF
    Please let me know how we can display date in correct format(not in milliseconds) if we dont have datapoints

    #35672

    @vsingh,

    Can you please create a JSFiddle reproducing the issue you are facing and share it with us along with sample JSON data so that we can look into the code, understand the scenario better and help you out?

    ___________
    Indranil Deo
    Team CanvasJS

    #37378

    Hi @indranil,

    Thanks for replying. Please find below the link to JSfiddle
    https://jsfiddle.net/pmn05g3u/
    if we use data point dps1 we get the correct date format. But if we pass an empty array i.e. dps2 it shows the date in milliseconds. Also, check the below links for screenshots.
    https://drive.google.com/file/d/15NK_vjvhd18th11xiajWYbA4iNsVyTy3/view?usp=sharing(not working),
    https://drive.google.com/file/d/1jMQBTo280GvdEBHUcfo0-JA0r11wF8tI/view?usp=sharing(working)

    #37405

    @vsingh,

    In case there are no dataPoints to be rendered, you can add a dummy dataPoint by setting the x-value as axis-x minimum and y-value as 0 to achieve your requirement. Please find the code snippet for the same below.

    function checkIfNoDataPoints() {
      for(var i = 0; i < chart.options.data.length; i++) {
        if(chart.options.data[i].dataPoints.length == 0) {
          chart.options.data[i].dataPoints.push({x:chart.axisX[0].get("minimum"), y:0, color: "transparent", toolTipContent: null, indexLabel: " "})
        }
      }
      chart.render();
    }

    Please take a look at this JSFiddle for a working example
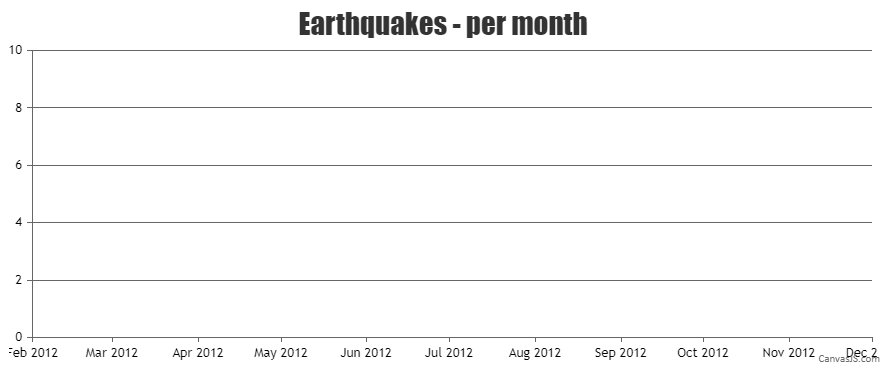
    Chart withtout dataPoints


    Thangaraj Raman
    Team CanvasJS

Viewing 4 posts - 1 through 4 (of 4 total)

You must be logged in to reply to this topic.