@mustadirmahmood,
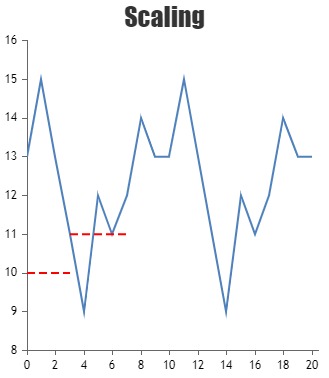
You can set chart’s width & height dynamically by keeping plot-area width & height to be a constant value by manually calculating with the help of axis bounds. Please find the code-snippet below.
  var axisXBounds = chart.axisX[chart.axisX.length - 1].get("bounds");
  var axisYBounds = chart.axisY[chart.axisY.length - 1].get("bounds");

  var plotAreaWidth = 300;
  var plotAreaHeight = 300;

  var chartWidth = axisXBounds.x1 + plotAreaWidth;
  var chartHeight = chart.height - (axisYBounds.y2) + axisYBounds.y1 + plotAreaHeight;

  chart.set("width", chartWidth, false);
  chart.set("height", chartHeight);
Please take a look at this JSFiddle for a working example.

—-
Ranjitha R
Team CanvasJS