Home Forums Feature Requests & Feedback Render pie chart when all values are 0

Render pie chart when all values are 0

Viewing 4 posts - 1 through 4 (of 4 total)
  • #9096

    It would be nice that if all values for a pie chart were zero that it would generate pie chart as a solid color instead of an empty box.

    My page shows metrics for releases that happen every month, and every month these metrics start at zero. What i’ve done as a work around is set one of the values to a negative number and displayed 0% on all data points. The only problem with that method is I had to write custom code to exclude negative numbers from calculations and tabular views.

    Although visibly everything looks good, the tool tip will still show the negative value used to render the chart. I know I can always go into the javascript and fix that myself but figured I’d put in a feature request in the event others had the need for this.
    #9103

    Thanks for your suggestion. We will consider this for future versions.

    __
    Anjali

    #33796

    Any update by when this feature will be added

    #33814

    @kpandey017,

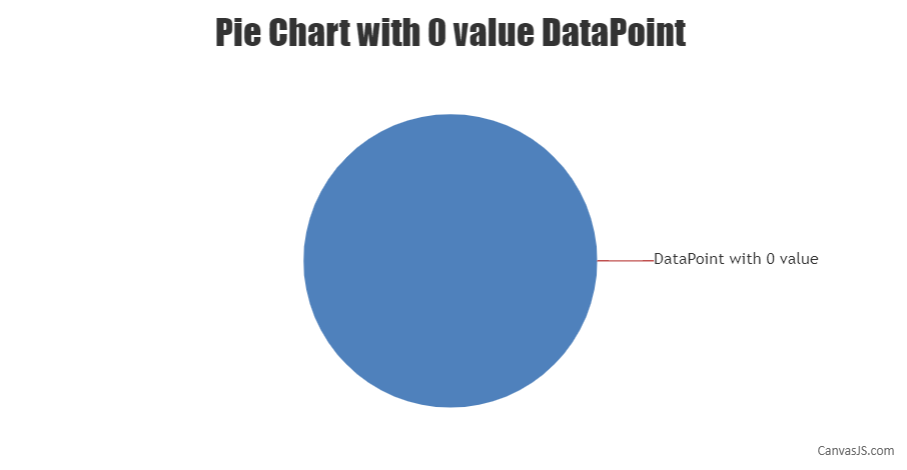
    It is not possible to show dataPoint with 0 value on pie chart as of now. However, indexLabel for dataPoints with 0 value is displayed. In your case, you can pass dataPoints with negligible values along with 0 value dataPoint and indexLabel.

    Please take a look at this JSFiddle for an example.

    Pie chart with 0 value dataPoint

    ___________
    Indranil Deo
    Team CanvasJS

Viewing 4 posts - 1 through 4 (of 4 total)

You must be logged in to reply to this topic.