You must be logged in to post your query.
Home › Forums › StockChart Support › Render charts based on checkbox selection
Tagged: React
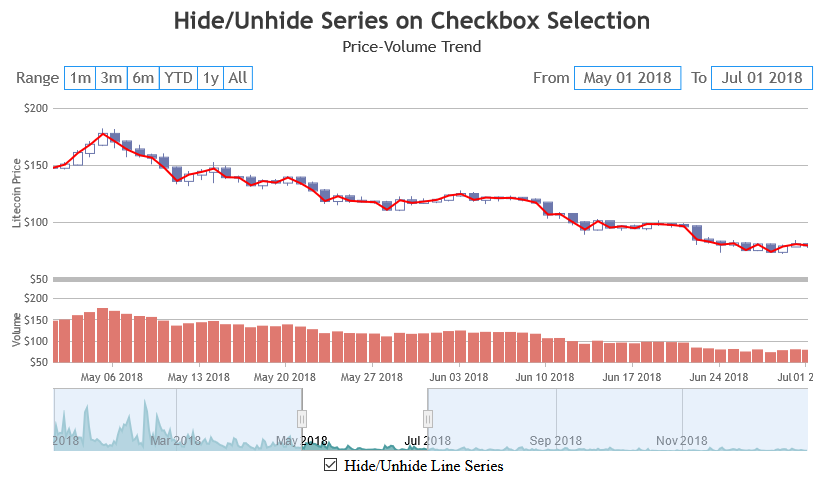
From https://canvasjs.com/react-stockcharts/stockchart-date-time-axis-react/ this graph,
I want to add a line graph in a candlestick chart.
However, I want to render a line graph when a checkbox is clicked.
Is it available with multiple data with React?
@wellhys,
Yes, you can show a line series when a checkbox is checked and hide it when the checkbox is unchecked by toggling the visible property.
Please take a look at this StackBlitz for an example.
___________ Indranil Deo Team CanvasJS
Thank you so much!
You must be logged in to reply to this topic. Login/Register