@karthicksivan,
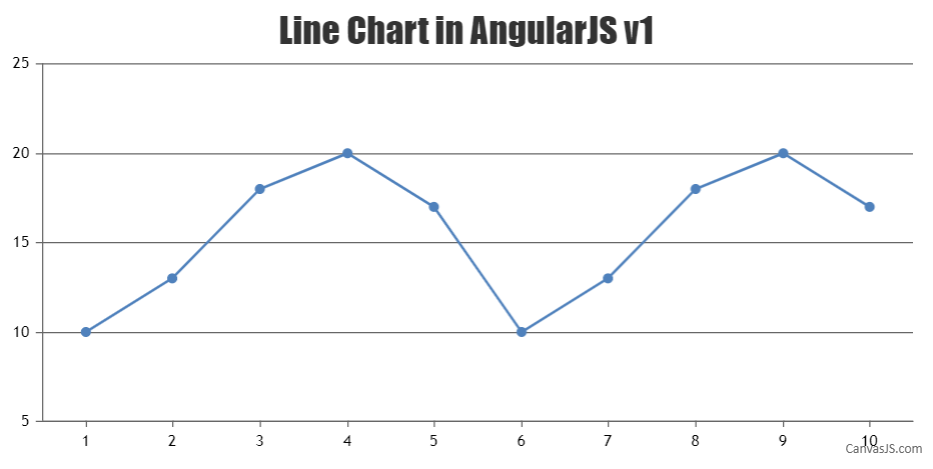
You can integrate CanvasJS with AngularJS by rendering the chart inside a controller as shown in the code snippet below –
myapp.controller("adminDashboardController", ["$scope",function($scope){
  var dps = [{x: 1, y: 10}, {x: 2, y: 13}, {x: 3, y: 18}, {x: 4, y: 20}, {x: 5, y: 17},{x: 6, y: 10}, {x: 7, y: 13}, {x: 8, y: 18}, {x: 9, y: 20}, {x: 10, y: 17}];
  var chartOptions ={
    title: {
    	text: "Line Chart in AngularJS v1"
    },
    data: [{
      type: "line",
      dataPoints : dps
    }]
  };
  var chart = new CanvasJS.Chart("chartContainer", chartOptions);
  chart.render();
}]);
Please take a look at this JSFiddle for an example.

___________
Indranil Deo
Team CanvasJS
