Home Forums Chart Support React rendering canvasjs chart with mapping

React rendering canvasjs chart with mapping

Viewing 4 posts - 1 through 4 (of 4 total)
  • #33871

    I am trying to render canvasjs charts using React.

    https://jsfiddle.net/fg70s6zh/1/

    I have pushed options in array and iterated to render charts using mapping.

    Can anybody help me what’s wrong?

    • This topic was modified 3 years, 8 months ago by wellgdgd.
    #33873

    I have solved it. Thank you for your consideration.

    I changed the curly bracket and put the <div> attribute.

    https://jsfiddle.net/5gown7ud/1/

    Here is how I have done.

    #33891

    @wellhys,

    In the code shared by you, there is a syntax error while pushing the chart-options to the options array. Pushing the chart-options as shown in the code snippet below should work fine –

    options.push({
      title: {
        text: "Basic Column Chart in React"
      },
      data: [{				
        type: "column",
        dataPoints: [
          { label: "Apple",  y: 10  },
          { label: "Orange", y: 15  },
          { label: "Banana", y: 25  },
          { label: "Mango",  y: 30  },
          { label: "Grape",  y: 28  }
        ]
      }]
    })

    Please take a look at this StackBlitz example for a working code.
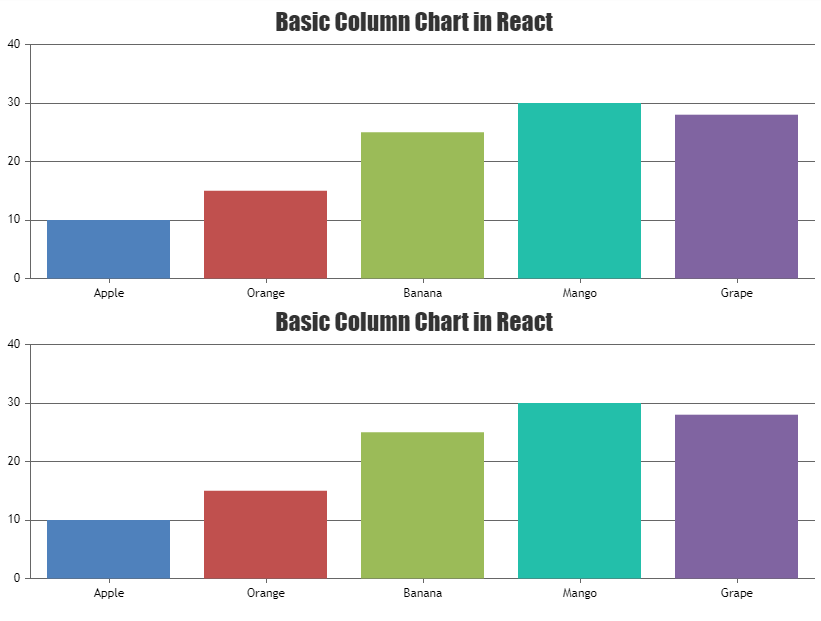
    Create multiple charts in react through loop

    ___________
    Indranil Deo
    Team CanvasJS

    #33903

    Thank you for fixing!

Viewing 4 posts - 1 through 4 (of 4 total)

You must be logged in to reply to this topic.