Home Forums Chart Support React Canvas JS: Drag Data points in Line chart

React Canvas JS: Drag Data points in Line chart

Viewing 8 posts - 1 through 8 (of 8 total)
  • #25022

    I am looking solution to drag data points in Line Chart : Need to know the latest data points after dragging points.

    #25041

    @tilakbhanugmail-com,

    To create a chart with draggable dataPoints you can attach event handlers to div with id "canvasjs-react-chart-container-0" in React so as to perform necessary actions when user clicks or drags inside the div as shown in the code snippet below:

    $("#canvasjs-react-chart-container-0 > .canvasjs-chart-container").on({
      mousedown: function(e) {
        _this.mouseDown = true;
        _this.getPosition(e);  
        _this.searchDataPoint();
      },
      mousemove: function(e) {
        _this.getPosition(e);
        if(_this.mouseDown) {
          clearTimeout(_this.timerId);
          _this.timerId = setTimeout(function(){
            if(_this.selected != null) {
              chart.data[0].dataPoints[_this.selected].y = _this.yValue;
              chart.render();
            }   
          }, 0);
        }
        else {
          _this.searchDataPoint();
          if(_this.changeCursor) {
            chart.data[0].set("cursor", "n-resize");
          } else {
            chart.data[0].set("cursor", "default");
          }
        }
      },
      mouseup: function(e) {
        if(_this.selected != null) {
          chart.data[0].dataPoints[_this.selected].y = _this.yValue;
          chart.render();
          _this.mouseDown = false;
        }
      }
    });

    Please take a look at this Sample Project for a working example with sample code.
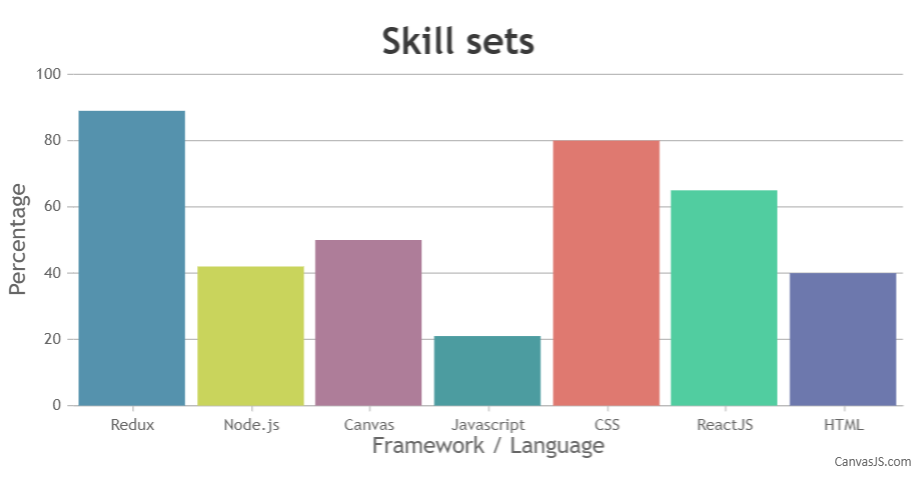
    CanvasJS chart with draggable dataPoints in React


    Vishwas R
    Team CanvasJS

    #25053

    Thank you Vishwas for your quick reply, You uploaded code for Bar chart. I hope the same piece of code/logic works for Line chart

    #25067

    @tilakbhanugmail-com,

    The solution seems to be working fine with all chart types including column, line, area charts.


    Vishwas R
    Team CanvasJS

    #25079

    cool, thank you Vishwas for helping in evaluating canvas js charts, I am looking forward your support to complete my POC on Canvas JS charting application.

    #25080

    I want to render more than one line in the line chart, I tried it and it is working fine.
    Drag and Drop Data points : I see the code which you shared written to handle only one line, Hopefully changing the logic to multiple should work with out any issues. If not please let me know how to handle this scenario.

    #25082

    @tilakbhanugmail-com,

    The sample shared demonstrates an approach to achieve draggable chart with single dataSeries. However changing the logic to make it work with multi-series chart should work fine in this case.


    Vishwas R
    Team CanvasJS

    #25085

    Thanks for the confirmation.

Viewing 8 posts - 1 through 8 (of 8 total)

You must be logged in to reply to this topic.