You must be logged in to post your query.
Home › Forums › Chart Support › Range area chart different lines color
Tagged: ichimoku, Range
Hi,
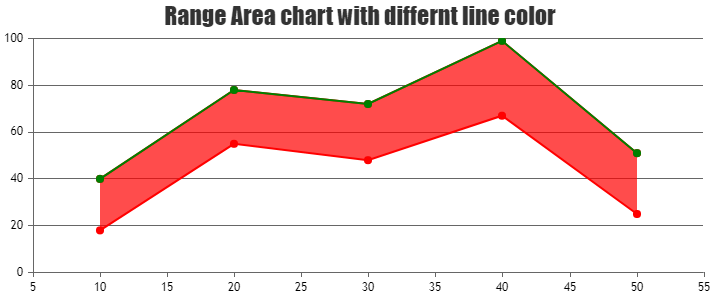
is it possible to have a different colour for each line of the range area chart ?
I’m trying to integrate the cloud of the Ichimoku indicators where the “top” line could reverse with the “bottom” line…
https://fr.wikipedia.org/wiki/Ichimoku_kink%C5%8D_hy%C5%8D#/media/Fichier:Ichimoku_vue_ensemble_fig1.png
Thanks
@mushu8,
You can add one more dataseries with type set to ‘line‘ with the ‘y’ values same as one of the range values in range area chart.
Kindly look at this JSFiddle for the working example for the same.
__ Sachin Bisht Team CanvasJS
You must be logged in to reply to this topic. Login/Register