Login to Ask a Question or Reply
You must be logged in to post your query.
Home › Forums › Chart Support › Problem zooming to the end of a chart
Problem zooming to the end of a chart
- This topic has 21 replies, 3 voices, and was last updated 4 years, 7 months ago by
aidan100.
-
May 21, 2021 at 3:11 am #34380
Hi, any word on if this issue has any priority at all? I am experiencing the same usability issues with users having a hard time getting a pixel-perfect zoom in of the latest data. The user pl7 who posted above “the selection area simply clamped to the appropriate chart edge whenever the mouse moves outside the valid region.” sounds like an ideal solution and expected behavior.
-
This reply was modified 4 years, 9 months ago by
inetintel.
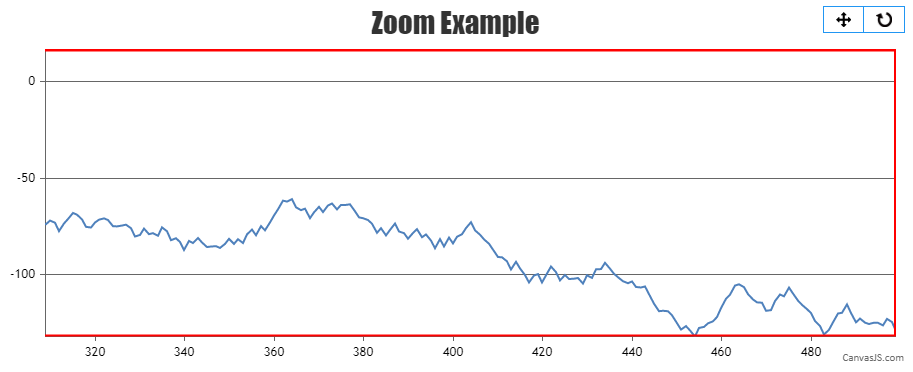
May 24, 2021 at 7:51 pm #34420To zoom into the extreme end of the plot area, you need to first check difference between the viewportMinimum/viewportMaximum and minimum/maximum of axes. If the difference is less than a specified threshold, you can set the viewportMinimum/viewportMaximum to the minimum/maximum value of the axes respectively inside the rangeChanged event handler as shown below –
var extremeRangeThreshold = 30;
.
.
rangeChanged: rangeChangedHandler,
.
.
function rangeChangedHandler(e) {
  if(e.trigger === "reset") {
    chart.options.axisX.viewportMinimum = null;
    chart.options.axisX.viewportMaximum = null;
    chart.options.axisY.viewportMinimum = null;
    chart.options.axisY.viewportMaximum = null;
    chart.render();
    return;
  }

  if(e.trigger === "zoom"){
    if(e.chart.axisX[0].maximum - e.chart.axisX[0].viewportMaximum <= extremeRangeThreshold){
      chart.options.axisX.viewportMaximum = null;
      chart.render();
      chart.options.axisX.viewportMaximum = e.chart.axisX[0].maximum;
    }

    if(e.chart.axisX[0].viewportMinimum - e.chart.axisX[0].minimum <= extremeRangeThreshold){
      chart.options.axisX.viewportMinimum = null;
      chart.render();
      chart.options.axisX.viewportMinimum = e.chart.axisX[0].minimum;
    }

    if(e.chart.axisY[0].maximum - e.chart.axisY[0].viewportMaximum <= extremeRangeThreshold){
      chart.options.axisY.viewportMaximum = null;
      chart.render();
      chart.options.axisY.viewportMaximum = e.chart.axisY[0].maximum;
    }

    if(e.chart.axisY[0].viewportMinimum - e.chart.axisY[0].minimum <= extremeRangeThreshold){
      chart.options.axisY.viewportMaximum = null;
      chart.render();
      chart.options.axisY.viewportMinimum = e.chart.axisY[0].minimum;
    }
    chart.render();
  }
}
Please check this JSFiddle for a complete working code.

___________
Indranil Deo
Team CanvasJSMay 25, 2021 at 2:32 am #34424Hey thank you for the response!
I think what the ask is here, and at least what I’m looking for (may be a fresh ticket?), is exemplified some here: https://postimg.cc/hf4xczKp. When holding down the active selection in the graph, and dragging beyond the red line, the active selection disappears though the selection is still active so long as the user continues to hold down the mouse before moving it back into frame, this has been leading to some confusion. What I’m looking for is for the highlight to remain visibly active as the mouse moves beyond that red line, and if the mouse is released beyond that red line, to zoom into the selection made. Instead of the current behavior where the active selection is not used to be zoomed into when the mouse is released beyond that red line at the edge of the chart.
Hopefully that makes sense, happy to clarify further if need be.
May 26, 2021 at 6:49 am #34453Mouse events are captured only when mouse is on top of the chart. Any mouse event fired outside of the chart cannot be captured. Hence, it is not possible to trigger the zoom when mouse event is fired out of the chart as of now.
However, we will reconsider this behavior in future releases.
___________
Indranil Deo
Team CanvasJSJune 9, 2021 at 2:56 am #34561Thank you for reconsidering! Would it be possible to do something like pass an optional function prop from the parent component to canvasjs that can help manage tracking the mouse location beyond the confines of the canvasjs component?
June 16, 2021 at 6:22 pm #34661Currently, the chart component has its own zoom and pan functionality, and cannot consume any events fired from a parent component that could trigger the zoom event.
___________
Indranil Deo
Team CanvasJSJuly 1, 2021 at 12:56 pm #34753Hey I’m having same problem here – try to zoom to edge of chart but it just disappears! Very frustrating.
Is there a solution to this yet? First reported in 2017 and pretty major usability issue, will look for other products if not possible.
Thank you!
-
This reply was modified 4 years, 9 months ago by
You must be logged in to reply to this topic.