@glowery,
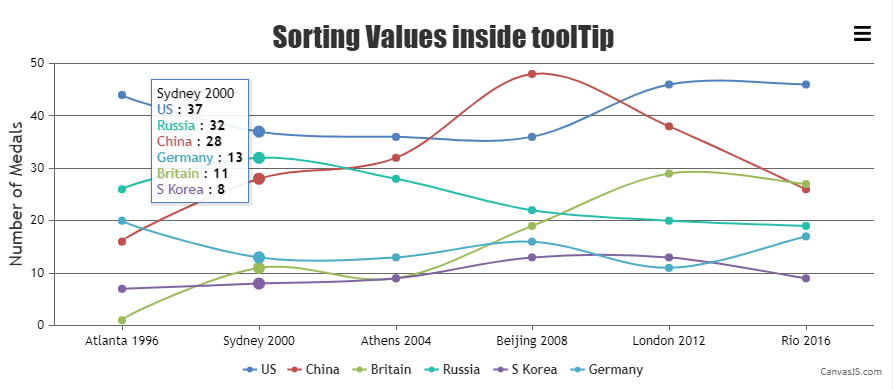
CanvasJS chart supports sorting the tooltip based on y-values with the help of contentFormatter. Please find the code-snippet below –
toolTip: {
  shared: true,
    contentFormatter: function (e) {
      var content = "";

      e.entries.sort(function(a,b) {
        return b.dataPoint.y - a.dataPoint.y;
      });

      content	+= e.entries[0].dataPoint.label;
      content += "<br/>";

      var entries = e.entries;
      for(var j = 0; j < entries.length; j++) {
        content	+= "<span style=\"color:" + entries[j].dataSeries.color+"\"\>" + entries[j].dataSeries.name + " </span>: " + "<strong>" + entries[j].dataPoint.y + "</strong>";
        content += "<br/>";
      }
      return content;

    }
},
Kindly take a look at this JSFiddle for a working example with complete code.

___________
Indranil Singh Deo
Team CanvasJS