Login to Ask a Question or Reply
You must be logged in to post your query.
Home › Forums › Chart Support › MySQL – (Displaying Date-Time values on a Chart Axis)
MySQL – (Displaying Date-Time values on a Chart Axis)
- This topic has 10 replies, 2 voices, and was last updated 7 years, 7 months ago by
JohnSnowGum.
Tagged: PHP SQL DataBase
-
July 24, 2018 at 6:46 pm #21954
So I’m looking to do what’s achieved here but my data is from a MySQL Database. But I need to count the total times that date is listed automatically instead of manually.
For example;
In my database, I have the following dates,
2016-08-30 ~ 2016-10-23 ~ 2016-10-23 ~ 2017-02-12 ~ 2018-08-30 ~ 2018-08-30 ~ 2017-02-12
and in my graph, I want the,
(axis)
X = date
Y = amount that date is listed in DataBase
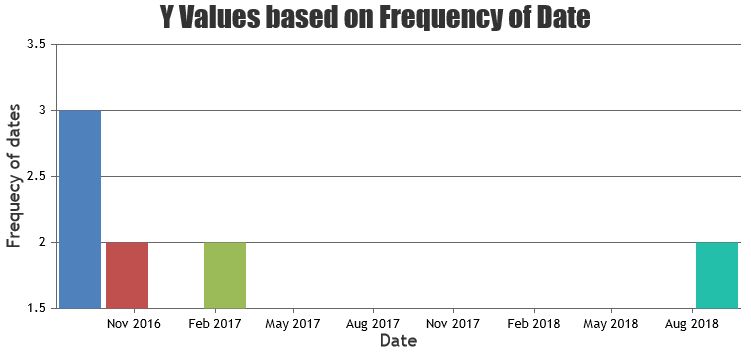
so the result should look like this,
X = 2016-08-30 ~ 2016-10-23 ~ 2017-02-12 ~ 2018-08-30
y = 1 ~ 2 ~ 2 ~ 2I hope this all made sense :)
Thanks in advance.
July 25, 2018 at 12:28 pm #21961JohnSnowGum,
You can calculate the frequency the date-occurrences in the data & build a set of datapoints. Please refer the code-snippet below.
function calculateFrequency(dateArray) {
  dateArray.sort();
  var currentXValue = null;
  var count = 0;

  for (var i = 0; i < dateArray.length; i++) {
    if (dateArray[i] != currentXValue) {
      if (count > 0)
        dps.push({x: new Date(currentXValue), y: count});
      currentXValue = dateArray[i];
      count = 1;
    } else {
      count++;
    }
  }
  if (count > 0)
    dps.push({x: new Date(currentXValue), y: count});
}
Please take a look at this JSFiddle for complete code. This example reads data from an array instead of database.
__
Priyanka M S
Team CanvasJSJuly 25, 2018 at 3:21 pm #21964Yea that’s awesome, quick question? I’m using a JSON file to get the dates, how can I incorporate that into that example?
July 26, 2018 at 10:47 am #21982JohnSnowGum,
Please refer this documentation page for step-to-step tutorial on rendering chart with data from JSON source.
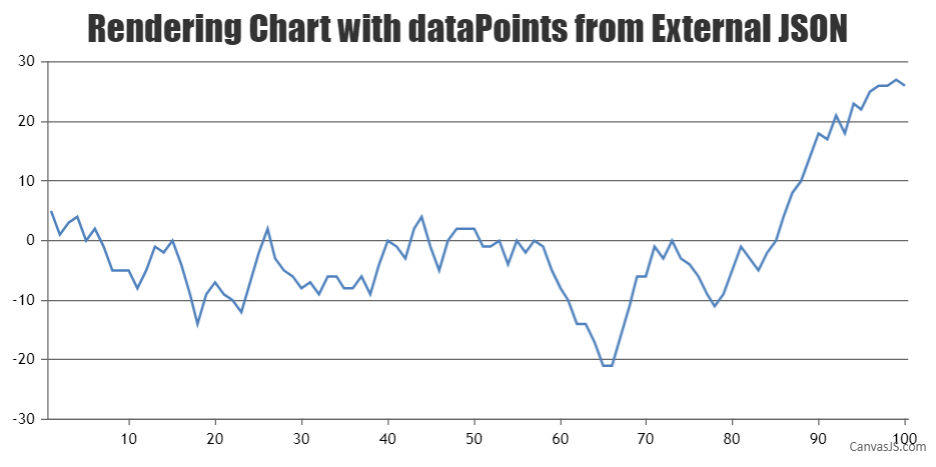
Please take a look into this JSFiddle for an example on chart with date here the data is served from an external JSON source.__
Priyanka M S
Team CanvasJSJuly 27, 2018 at 4:23 am #21998Thanks that’s perfect, quick of topic question how did you code your JSON? Your’s looks much better then mine :) http://banlister.com/graph-test/service.php
July 27, 2018 at 10:00 am #22000JohnSnowGum,
The JSON data we have provided is an array of objects. In your case, it’s an array of arrays.
__
Priyanka M S
Team CanvasJSJuly 27, 2018 at 5:14 pm #22015Ah ok. So my JSON should still work much like yours or do I need to change to be an array of objects (if so how would I do that? I’m not that familiar with JSON files in case you can’t tell) Thanks so much for Helping Priyanka :)
July 27, 2018 at 5:59 pm #22016When you use JSON data as an array of arrays, you need to slightly modify the above fiddle. Below is the code snippet.
for (var i = 0; i < dateArray.length; i++) {
  if (dateArray[i][0] != currentXValue) {
    if (count > 0)
      dps.push({x: new Date(currentXValue), y: count});
    currentXValue = dateArray[i];
    count = 1;
  } else {
    count++;
  }
}
Please take a look at this updated JSFiddle for complete code.
__
Priyanka M S
Team CanvasJSJuly 27, 2018 at 6:07 pm #22017I’m not sure what I’m doing wrong, but I have a feeling it’s my JSON code… Here is a jsfiddle using my JSON and here is the code behind my JSON
<?php

$username = "";
$password = "";
$dbname = "";

// Create connection
$conn = new mysqli('localhost',$username, $password, $dbname);
// Check connection
if ($conn->connect_error) {
    die("Connection failed: " . $conn->connect_error);
}

$sql = "SELECT date FROM db";
$result = $conn->query($sql);

if ($result->num_rows > 0) {
    // output data of each row
	$obj = array();
    while($row = $result->fetch_assoc()) {
		$element = array($row["ban_date"]);
       	array_push($obj,$element);
	}
	echo json_encode($obj);
} else {
    echo "0 results";
}
$conn->close();
?>
Tagged: PHP SQL DataBase
You must be logged in to reply to this topic.