You must be logged in to post your query.
Home › Forums › Chart Support › multiple value axes and line chart with different color
Tagged: multiple
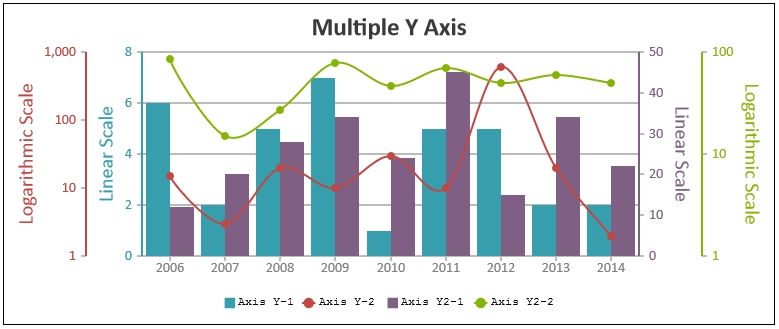
Hi I am looking to plot a graph with multiple Y axes value just like in http://www.amcharts.com/demos/multiple-value-axes/ and having a line chart with different color like http://www.amcharts.com/demos/line-with-changing-color/
Does canvasjs support any of these options now
Thanks Antony
You can create a line chart with different colors using canvasjs, you just create a multi-series graph and each data series can have a different color that you can specify.
[Update] Hi,
We have just released v1.9.5 Beta which supports Secondary X Axis and Multiple X / Y Axis. Please refer to the release blog for more information.
— Vishwas R
You must be logged in to reply to this topic. Login/Register