Login to Ask a Question or Reply
You must be logged in to post your query.
Home › Forums › Chart Support › multiple chart in one page
multiple chart in one page
- This topic has 2 replies, 2 voices, and was last updated 7 years, 9 months ago by
Priyanka M S.
-
May 16, 2018 at 10:49 pm #20752
Hello
I hope you’re fine
Unfortunately, my English language and programming are weak.
This is my program, which is a chart with 4dataseries that relates to the size of the four measured gases.
Now I need to repeat the same graph with the same names but with a different data received from a data file txt text file
Help me please
I need 16 charts on one page
<!DOCTYPE HTML>
<html>
<head>
<body>
<?phpwindow.onload = function () {
// dataPoints
var dataPoints1 = [];
var dataPoints2 = [];
var dataPoints3 = [];
var dataPoints4 = [];var chart = new CanvasJS.Chart(“chartContainer”,{
zoomEnabled: true,
title: {
text: “Measurement of gases”
},
toolTip: {
shared: true},
legend: {
verticalAlign: “top”,
horizontalAlign: “center”,
fontSize: 14,
fontWeight: “bold”,
fontFamily: “calibri”,
fontColor: “dimGrey”
},
axisX: {
title: “chart updates every 60 sec ”
},
axisY:{
prefix: ”,
includeZero: false
},
data: [{
// dataSeries1
type: “line”,
xValueType: “dateTime”,
showInLegend: true,
name: “AIR”,
dataPoints: dataPoints1
},
{
// dataSeries2
type: “line”,
xValueType: “dateTime”,
showInLegend: true,
name: “N2O” ,
dataPoints: dataPoints2
},
{
// dataSeries3
type: “line”,
xValueType: “dateTime”,
showInLegend: true,
name: “O2” ,
dataPoints: dataPoints3
},
{
// dataSeries4
type: “line”,
xValueType: “dateTime”,
showInLegend: true,
name: “VACUUM” ,
dataPoints: dataPoints4}],
legend:{
cursor:”pointer”,
itemclick : function(e) {
if (typeof(e.dataSeries.visible) === “undefined” || e.dataSeries.visible) {
e.dataSeries.visible = false;
}
else {
e.dataSeries.visible = true;
}
chart.render();
}
}
});var updateInterval = 60000;
// initial value
var yValue1 = 0;
var yValue2 = 0;
var yValue3 = 0;
var yValue4 = 0;var updateChart = function (AIR,N2O,O2,VACUUM,tt) {
yValue1 = AIR;
yValue2 = N2O;
yValue3 = O2;
yValue4 = VACUUM;// pushing the new values
dataPoints1.push({
x: tt,
y: yValue1
});
dataPoints2.push({
x: tt,
y: yValue2
});
dataPoints3.push({
x: tt,
y: yValue3
});
dataPoints4.push({
x: tt,
y: yValue4
});
};var doupdate = function (AIR,N2O,O2,VACUUM) {
// updating legend text with updated with y Value
yValue1 = AIR;
yValue2 = N2O;
yValue3 = O2;
yValue4 = VACUUM;
chart.options.data[0].legendText = ” AIR: ” + yValue1;
chart.options.data[1].legendText = ” N2O: ” + yValue2;
chart.options.data[2].legendText = ” O2: ” + yValue3;
chart.options.data[3].legendText = ” VACUUM: ” + yValue4;
chart.render();
};var newres = function () {
var xhttp = new XMLHttpRequest();
xhttp.onreadystatechange=function() {
if (this.readyState == 4 && this.status == 200) {
resdata = JSON.parse(this.responseText);
updateChart(resdata.AIR,resdata.N2O,resdata.O2,resdata.VACUUM,resdata.time);
doupdate(resdata.AIR,resdata.N2O,resdata.O2,resdata.VACUUM);
}
};
xhttp.open(“POST”, “gettemp.php?q=dht&t=” + Math.random(), true);
xhttp.send();
};// generates first set of dataPoints
<?phpDate_default_timezone_set(‘Asia/Tehran’);
$file = ‘temp.txt’;$data = file_get_contents($file);
$arr = explode(PHP_EOL, $data);
for ($i = 0; $i < count($arr); $i++) {
if (strpos($arr[$i], ‘null’) !== false || empty($arr[$i]) || ctype_space($arr[$i])) {
unset($arr[$i]);
}
}
if(!empty($arr)){
foreach($arr as $a){
if(!empty($a)){
$dec = json_decode($a, true);
echo “updateChart(“.$dec[0].”,”.$dec[1].”,”.$dec[2].”,”.$dec[3].”,”.$dec[4]*1000 .”);”;
$lAIR = $dec[0];
$lN2O = $dec[1];
$lO2 = $dec[2];
$lVACUUM = $dec[3];
}
}
echo ‘doupdate(‘.$lAIR.’,’.$lN2O.’,’.$lO2.’,’.$lVACUUM.’);’;
}?>
// update chart after specified interval
setInterval(function(){newres()}, updateInterval);
}
</script>
<script type=”text/javascript” src=”canvasjs.min.js”></script>
</head>
<body>
<div id=”chartContainer” style=”height: 300px; width: 100%;”>
</div>
</body>
</html>
samaneh.azmoodeh@gmail.comMay 17, 2018 at 10:01 am #20763@samira.2018,
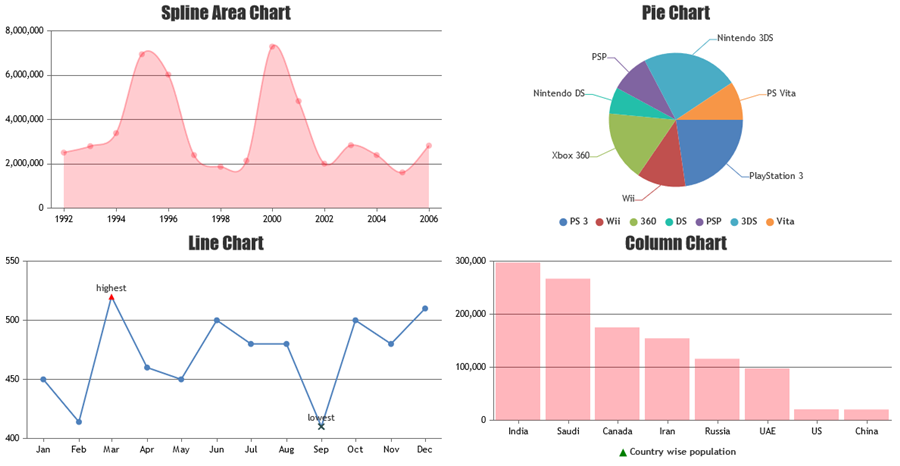
It is possible to display multiple charts in the same page with the same chart options and different dataPoints.
You will have to create multiple chartContainers with separate id for each, and create multiple charts which you can assign to specific chartContainers and call the corresponding chart render method.
Please take a look at the code snippet below,var chart1 = new CanvasJS.Chart("chartContainer1",{ title :{ text: "Live Data" }, data: [{ type: "line", dataPoints : [ { label: "apple", y: 10 }, { label: "orange", y: 15 }, { label: "banana", y: 25 }, { label: "mango", y: 30 }, { label: "grape", y: 28 } ] }] }); var chart2 = new CanvasJS.Chart("chartContainer2",{ title :{ text: "Live Data" }, data: [{ type: "column", dataPoints : [ { label: "apple", y: 10 }, { label: "orange", y: 15 }, { label: "banana", y: 25 }, { label: "mango", y: 30 }, { label: "grape", y: 28 } ] }] }); chart1.render(); chart2.render();Also, kindly take a look at our documentation page for a step-by-step tutorial on how to render multiple charts in a page.

__
Priyanka M S
Team CanvasJS-
This reply was modified 7 years, 9 months ago by
Priyanka M S.
-
This reply was modified 7 years, 9 months ago by
You must be logged in to reply to this topic.