Login to Ask a Question or Reply
You must be logged in to post your query.
Home › Forums › Feature Requests & Feedback › logarithmic function
logarithmic function
- This topic has 8 replies, 3 voices, and was last updated 4 years, 4 months ago by
Manoj Mohan.
Tagged: Log Values
-
May 18, 2020 at 8:20 pm #29296
Dear Team,
I’d like to display values from -1000 tot 1000 in my graph on a logarithmic scale.
I understand that I cannot take the log of a negative number.Is it possible to plot a negative value?
i can imagine something like
fictional_Log(100) = log(absolute(100))*1 = 2; (and see 100 as value in the graph within an logarithmic scale )
fictional_Log(-100) = log(absolute(-100))* -1 = -2; (and see -100 as value in the graph)with kind regards,
Ron
-
This topic was modified 5 years, 8 months ago by
WR.
May 19, 2020 at 10:06 pm #29306Ron,
A logarithmic axis can only plot positive values. There simply is no way to put negative values or zero on a logarithmic axis.
Fundamental: If 10L = Z, then L is the logarithm (base 10) of Z. If L is a negative value, then Z is a positive fraction less than 1.0. If L is zero, then Z equals 1.0. If L is greater than 0, then Z is greater than 1.0. Note that there no value of L will result in a value of Z that is zero or negative. Logarithms are simply not defined for zero or negative numbers.
—-
Manoj Mohan
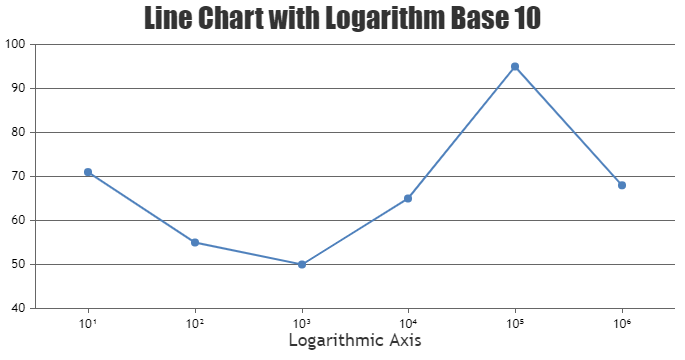
Team CanvasJSSeptember 13, 2021 at 6:18 pm #35697How do i show the log values 10 to the power 3 in x- axis as like in the image? Log values
September 14, 2021 at 6:45 pm #35718You can use unicode characters in labelFormatter to display power (subscript) values in the axis labels. Please check out the code snippet for the same.
var unicodeStringForSubscript = ["\u2070", "\u00B9", "\u00B2", "\u00B3", "\u2074", "\u2075", "\u2076", "\u2077", "\u2078", "\u2079"]
.
.
 axisX:{
      title: "Logarithmic Axis",
      logarithmic: true,
      logarithmBase: 10,
      labelFormatter: function(e) {
        return 10 + unicodeStringForSubscript[Math.ceil(Math.log(e.value)/Math.log(10))] ;
      }
.
.
Also, take a look at this JSFiddle for a complete working code.

—-
Manoj Mohan
Team CanvasJSSeptember 14, 2021 at 7:03 pm #35721Thanks a lot @manoj-mohan.
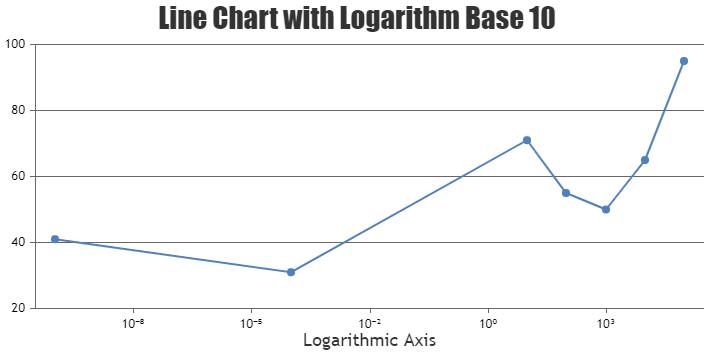
September 14, 2021 at 7:18 pm #35722Does this handle both positive and negative values like 10^6 and 10^-6? it returns values as NaN when the values are in negative.
-
This reply was modified 4 years, 4 months ago by
Elanchezhiyan.
September 15, 2021 at 6:39 pm #35738Previously shared code seems to work fine with positive values. The logic can be improved to make it work with negative values as shown in the below code-snippet
function getSubscriptString(value) {
    var subscriptValue = Math.ceil(Math.log(value)/Math.log(10));

    //Handling double digit numbers
    if(subscriptValue > 9 || subscriptValue < -9) {
      return (subscriptValue < -9 ? "\u207B" : "") + (Math.abs(subscriptValue)+"").split('').reduce(
        function(prevVal,val) {
          return prevVal + unicodeStringForSubscript[val];
        }, "")
    }

    return (subscriptValue < 0 ? "\u207B": "") + unicodeStringForSubscript[Math.abs(subscriptValue)];
  }
..
axisX:{
      title: "Logarithmic Axis",
      logarithmic: true,
      logarithmBase: 10,
      labelFormatter: function(e) {
        return 10 + getSubscriptString(e.value);
      }
    }
..
Also, check out this JSFiddle for complete working sample.

—-
Manoj Mohan
Team CanvasJSSeptember 29, 2021 at 3:38 pm #35869Hi Manoj,
Here I get the repeated values as of 10^5. How do i remove that values, if repeated?September 30, 2021 at 4:44 pm #35882 -
This topic was modified 5 years, 8 months ago by
Tagged: Log Values
You must be logged in to reply to this topic.