@jhodgeswaterford,
In order to update a chart, you need to first change the options object and then call chart.render(). Kindly take a look at this documentation page for more info on updating Chart Options.
You can access the options via chart.options as shown in the code-snippet below,
function toggle() {
  if(chart.options.data[0].visible === true || chart.options.data[0].visible === undefined) {
    chart.options.data[0].visible = false;
    alert('Turn it off');
  } else {
    alert('Turn it on');
    chart.options.data[0].visible = true;
  }
  chart.render();
}
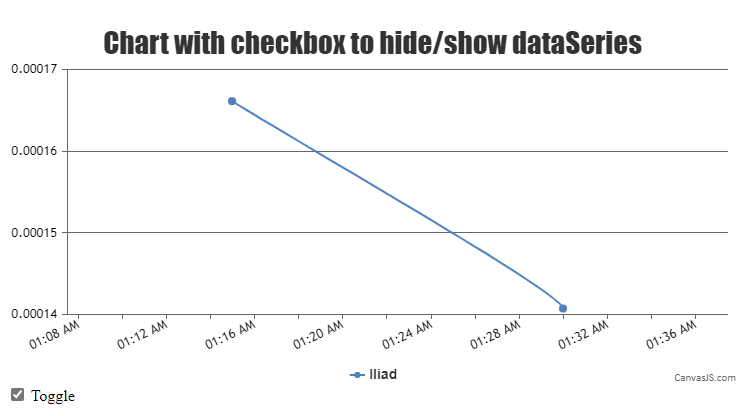
You can take a look at this updated JSFiddle for an example on using a checkbox to hide/show data series with complete code.
—
Adithya Menon
Team CanvasJS
.