Neha Mahanjan,
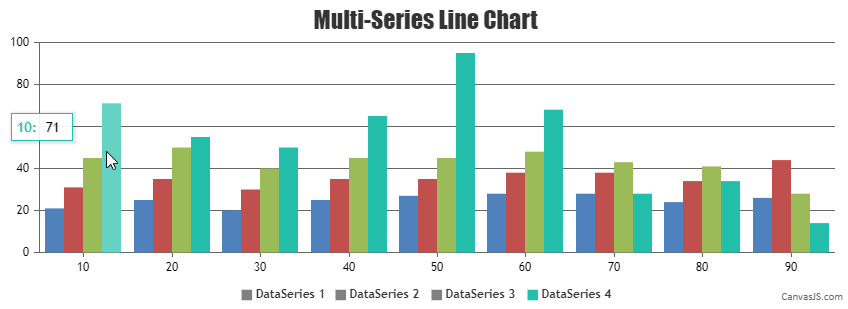
Highlighting legend on hover over chart series is not available as an inbuilt as of now. However you can achieve this functionality by updating legendMarkerColor within mousemove & mouseout events of dataseries as shown in this below codesnippet
for(var i=0; i<chart.options.data.length; i++) {
    chart.options.data[i].mouseover =  highlightLegend;
    chart.options.data[i].mouseout =  dimLegend;
  }

  chart.render();

  function highlightLegend(e) {
    for(var i=0; i<e.chart.options.data.length; i++) {
      if(i !== e.dataSeriesIndex)
        e.chart.options.data[i].legendMarkerColor = "grey";
    }

    e.chart.render();
  }
  function dimLegend(e) {
    for(var i=0; i<e.chart.options.data.length; i++) {
      e.chart.options.data[i].legendMarkerColor = undefined;
    }
    e.chart.render();
  }
Also, check out this JSFiddle for complete working code.

—
Manoj Mohan
Team CanvasJS