Login to Ask a Question or Reply
You must be logged in to post your query.
Home › Forums › Chart Support › Issue with logarithmic and value 0
Issue with logarithmic and value 0
- This topic has 8 replies, 3 voices, and was last updated 12 months ago by
efraga.
Tagged: 0, logarithmic, negative, zero
-
October 5, 2021 at 7:38 am #35917
Here is a simple example: https://jsfiddle.net/Latbc82r/. As you see if I set logarithmic to true on axisY, then if the value is 0, the column will be shown full height
October 5, 2021 at 6:29 pm #35928A logarithmic axis can only plot positive values. There simply is no way to put negative values or zero on a logarithmic axis.
Fundamental: If 10L = Z, then L is the logarithm (base 10) of Z. If L is a negative value, then Z is a positive fraction less than 1.0. If L is zero, then Z equals 1.0. If L is greater than 0, then Z is greater than 1.0. Note that there no value of L will result in a value of Z that is zero or negative. Logarithms are simply not defined for zero or negative numbers.
—
Vishwas R
Team CanvasJSOctober 5, 2021 at 10:14 pm #35936I understand the tech limitation. But from user’s perspective, if the value is 0 it is not supposed to show a max height column. Is it possible we handle the value 0 specifically?
October 6, 2021 at 7:09 pm #35952As zero value is not supported in logarithmic axis, you can set the value to null by parsing through the datapoints before rendering. Please find the code-snippet below.
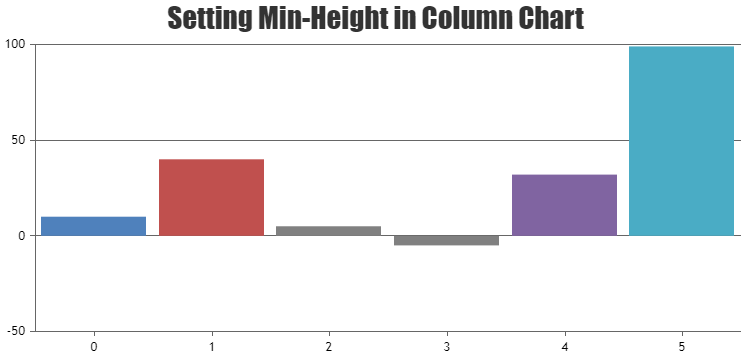
function parseZeroValue() {
  var data = chart.options.data;
  for(var i = 0; i < data.length; i++) {
    for(var j =0; j < data[i].dataPoints.length; j++) {
    var yValue = data[i].dataPoints[j].y;
      if(yValue === 0) {
        data[i].dataPoints[j].y = null; //Set this to some value like 0.01, if you like to show column
        data[i].dataPoints[j].toolTipContent = ("{x}: " + yValue);
      }
    }
  }
}
Please take a look at this JSFiddle for complete code. Also refer to this JSFiddle which shows how to set minimum height in column chart.
—
Vishwas R
Team CanvasJSOctober 7, 2021 at 9:20 am #35964This seems to work for column chart, but fails on spline chart: https://jsfiddle.net/0setgxqf/
October 7, 2021 at 6:21 pm #35977In case of line / spline chart, by default line will be broken when datapoint with null value is present. You can connect the non-null values directly by setting connectNullData property to true – which draws a dashed line to connect non-null datapoints. The type of this line can be changed by setting nullDataLineDashType property. Please refer to the code-snippet below.
...
data: [{
	...
	type: "line",
	connectNullData: true,
	nullDataLineDashType: "solid",
	...
}]
...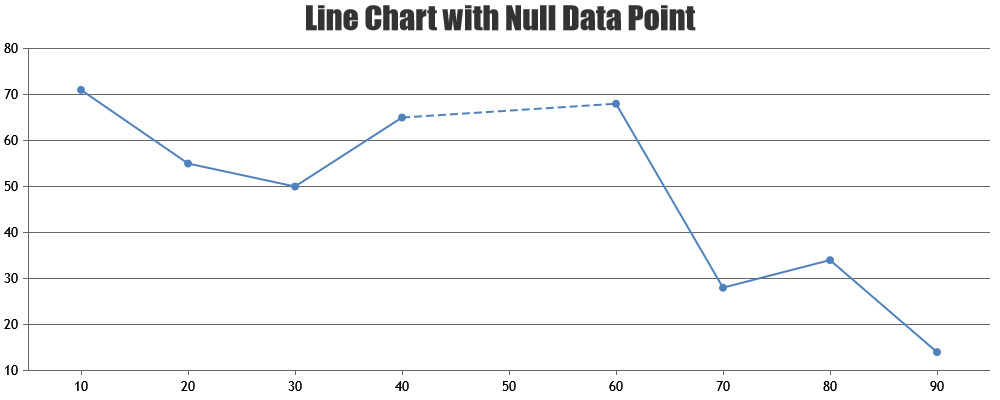
Please take a look at this updated JSFiddle for complete code.—
Vishwas R
Team CanvasJSOctober 7, 2021 at 9:34 pm #35981But with this workaround, the value 0 is not respected. In your example, at x=20, the line should go down to 0 then go back up, but it just bypassed it
October 11, 2021 at 6:07 pm #36000As mentioned in previous reply, 0 is not supported in logarithmic axis. However, as addressed in previously shared JSFiddle (line no 29), you can either set it to null or to some value like 0.1, 0.00001, etc. to keep the continuity in the line. Please take a look at this updated JSFiddle.
—
Vishwas R
Team CanvasJSMarch 25, 2025 at 11:57 pm #60788@zlwestwood & @vishwas Just an FYI, that while having a 0 (or negative value) on a logarithmic graph is not technically mathematically/visually representable (they would be infinitely low on a logarithmic graph), it was also our organization’s requirement to be able to still visualize such values on the logarithmic graph by at least setting them to the same value as our lowest y-axis label out of convenience. Setting them to the maximum value as CanvasJS currently does definitely does not make sense in the context of the data. While fixing this on our side is obviously possible by manually going through the data as @viswas suggested (and as we are currently doing), it could be far more convenient if such an option was simply provided at the level of the graphing library instead. I am sure that myself and @zlwestwood are likely not the only users with this requirement/issue.
-
This reply was modified 12 months ago by
-
This reply was modified 12 months ago by
Tagged: 0, logarithmic, negative, zero
You must be logged in to reply to this topic.