Home Forums Chart Support indexLabelPlacement for line graph

indexLabelPlacement for line graph

Viewing 4 posts - 1 through 4 (of 4 total)
  • #45842

    I am to write indexLabel dynamically above or below the line graph (logic is if the value is less than pervious month then it will be below the graph). But what is my code render is not similar. I think indexLabelPlacement is not working for line graph.

    my code:

    for (var i = 0; i < salesData.length; i++) {
    var currentValue = salesData[i].MachinesSold;
    var previousValue = i > 0 ? salesData[i – 1].MachinesSold : currentValue; // Get the previous value or default to the first

    // Determine whether to place the label above or below based on comparison with the previous month
    var labelPlacement = currentValue < previousValue ? “inside” : “outside”;

    // Push data with the correct label placement
    dataPoints.push({
    y: currentValue,
    label: salesData[i].Month,
    indexLabel: currentValue.toString(),
    indexLabelPlacement: labelPlacement, // Dynamic label placement
    indexLabelFontSize: 14,
    indexLabelFontColor: “black”
    });
    }
    #45852

    @amlan_wb,

    Indexlabels for line charts are placed to top of the marker, unless there is insufficient space towards the boundary of the plotarea. Hence, it’s not possible to place indexlabel to above or below markers as per the conditions in line chart.

    —-
    Manoj Mohan
    Team CanvasJS

    #45853

    So it is not possible to draw the graph in CanvasJS.chart . Is the team planning to build this feature in near future.

    #45872

    @amlan_wb,

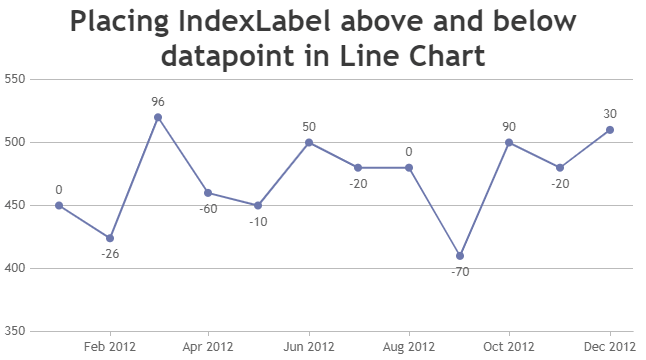
    You can use scatter chart to display indexLabel above and below the datapoint marker as shown in the code snippet below.

    
     var indexLabelSeries = {
        type: "scatter",
        markerSize: 0,
        highlightEnabled: false,
        toolTipContent: null,
        dataPoints: []
      };
    
      for(var i=0; i<chart.data[0].dataPoints.length; i++) {
        var dp = chart.data[0].dataPoints[i];
        lastDp = i > 0 ? chart.data[0].dataPoints[i-1].y : chart.data[0].dataPoints[i].y;
        labelPlacement = lastDp > chart.data[0].dataPoints[i].y ? "below": "above";
        indexLabelSeries.dataPoints.push({
          x: dp.x,
          y: chart.axisY[0].convertPixelToValue(chart.axisY[0].convertValueToPixel(dp.y) + (chart.data[0].markerSize + (labelPlacement == "below" ? -42 : -16 )) * (labelPlacement == "below" ? -1 : 1) ),
          indexLabel: "" + (chart.data[0].dataPoints[i].y - lastDp)
        });
      }
    
      chart.options.data.push(indexLabelSeries)
      chart.render();
    

    Also, check out this JSFiddle for complete code.

    Placing IndexLabel above and below datapoint in Line Chart

    —-
    Manoj Mohan
    Team CanvasJS

Viewing 4 posts - 1 through 4 (of 4 total)

You must be logged in to reply to this topic.