Home Forums Chart Support Index Labels in Range Area Charts

Index Labels in Range Area Charts

Viewing 4 posts - 1 through 4 (of 4 total)
  • #33855

    Hi.

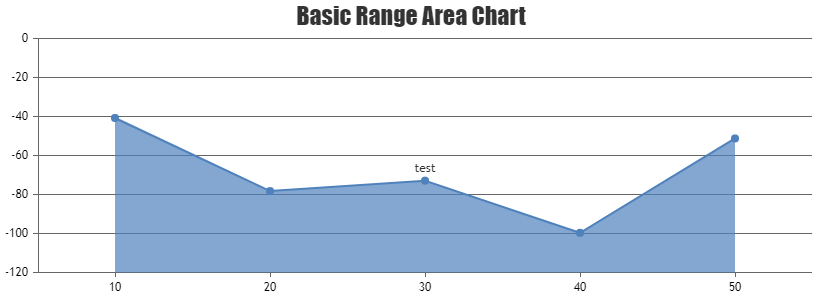
    In the Range Area Chart, is it possible to hide the IndexLabel at the bottom of the display like in this JSFiddle?

    #33859

    supplement:

    I want to hide the “test” at the bottom.

    #33879

    @kinokatsu,

    To display indexLabel only for specific index value (in your case 1), you can check the index of the indexLabel in indexLabelFormatter function and display the same. Please take a look at the code snippet below.

    indexLabelFormatter: function ( e ) {
              if(e.index === 1 && e.dataPoint.dataPointLabel)
                return e.dataPoint.dataPointLabel;
              else
                return " ";
            }

    Also, take a look at this JSFiddle for complete code.

    Hide indexLabel value for specific index of Range Area Chart

    —-
    Manoj Mohan
    Team CanvasJS

    #33896

    Hi Manoj Mohan.

    thanks for your reply.
    Thank you for JSFiddle sample.

    Great!

    This is what I wanted to do.

Viewing 4 posts - 1 through 4 (of 4 total)

You must be logged in to reply to this topic.