Login to Ask a Question or Reply
You must be logged in to post your query.
Home › Forums › Chart Support › How to use laptimes in minutes, seconds, milliseconds
How to use laptimes in minutes, seconds, milliseconds
- This topic has 5 replies, 2 voices, and was last updated 3 years, 11 months ago by
Manoj Mohan.
-
April 12, 2022 at 11:08 am #37387
Hi,
I want to create charts where is laptimes in selected period but i cant get it work.
My laptimes is in milliseconds on database, and if i generate them in the laptimes like this:
{ x: 1, y: 1:57:420 }, { x: 2, y: 1:57:340 }, { x: 3, y: 1:56:587 }, { x: 4, y: 1:56:225 }, { x: 5, y: 2:0:110 }, { x: 6, y: 2:2:102 }How i show them on chart?
I tested example this:
var options = {
animationEnabled: true,
title:{
text: “Monthly Sales – 2017”
},
axisX: {
valueFormatString: “m:s:fff”
},
axisY: {
title: “Sales (in USD)”,
prefix: “-“,
includeZero: false
},
data: [{
yValueFormatString: “”,
xValueFormatString: “m:s:fff”,
type: “spline”,
dataPoints: [ <? echo $data; ?>]
}]
};But i think the formatstrings need to be something else?
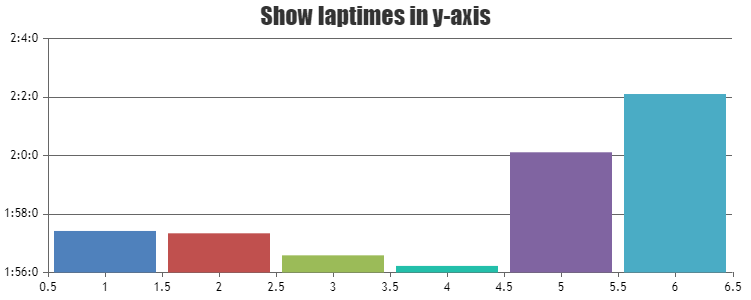
April 12, 2022 at 11:22 pm #37391Are you trying to show laptime in y-axis?
And also, can you kindly create sample project with your requirement and share it us over Google-Drive or One Drive so that we can understand your requirement better and help you out?
—-
Manoj Mohan
Team CanvasJSApril 14, 2022 at 6:16 pm #37446Hi, thanks for answer.
There is almost all code in my first post, the only question is how i use laptimes in different charts when format is example 1:57:420(minutes:seconds:milliseconds) ?
April 18, 2022 at 7:02 pm #37499You can convert your laptime format string to milliseconds and pass it as y-values in the dataSeries. For axis labels, you format the milliseconds passed to your desired format (minutes:seconds:milliseconds) using labelFormatter & contentFormatter for tooltip. Please find the code-snippet below.
var dps = [
    { x: 1, y: "1:57:420" },
    { x: 2, y: "1:57:340" },
    { x: 3, y: "1:56:587" },
    { x: 4, y: "1:56:225" },
    { x: 5, y: "2:0:110" },
    { x: 6, y: "2:2:102" }
  ]

  dps.forEach(dp => {
    var splitString = dp.y.split(":");
    dp.y = parseInt(splitString[0]) * 60 * 1000 + parseInt(splitString[1]) * 1000 + parseInt(splitString[2]);
  })

  function formatMilliSeconds(val) {
    var minutes = parseInt(val / (60 * 1000));
    var seconds = parseInt(val % (60 * 1000) / 1000);
    var ms = parseInt(val % (60 * 1000) % 1000);
    return minutes + ":" + seconds + ":" + ms;
  }

  var chart = new CanvasJS.Chart("chartContainer", {
    .
    .
    .
    axisY: {
      labelFormatter: function(e) {
        return formatMilliSeconds(e.value)
      }
    },
    toolTip: {
    	contentFormatter: function(e) {
      	toolTipContent = "";
      	e.entries.forEach( (entry) => {
        	toolTipContent += "x -> " + entry.dataPoint.x + "<br/>y -> " + formatMilliSeconds(entry.dataPoint.y) + "<br/>"
        })
      	return toolTipContent;
      }
    },
    .
    .
    .
  });
Also, check out this JSFiddle for complete working code.
—-
Manoj Mohan
Team CanvasJSApril 19, 2022 at 11:00 pm #37512Awesome! Thanks.
Can i show multiple charts in same page?
Tryed in few ways but always only 1 is showing up. Tryed offcourse different div id’s but its not enough.April 20, 2022 at 6:24 pm #37515Please take a look at this documentation page for step by step instruction for rendering multiple chart in a single page.

If you are still facing the issue, kindly create a sample project reproducing the issue you are facing and share it with us over Google-Drive or OneDrive so that we can look into the code, run it locally at our end to understand the scenario better and help you out.
—-
Manoj Mohan
Team CanvasJS
You must be logged in to reply to this topic.