@mohsaid,
You can update datapoints in the chart for every 2 seconds by changing chart-options & calling chart.render() within setInterval.
setInterval(function() {
	chart.options.data[0].dataPoints.push({x: 10, y: 20});
	chart.render();
}, updateInterval);
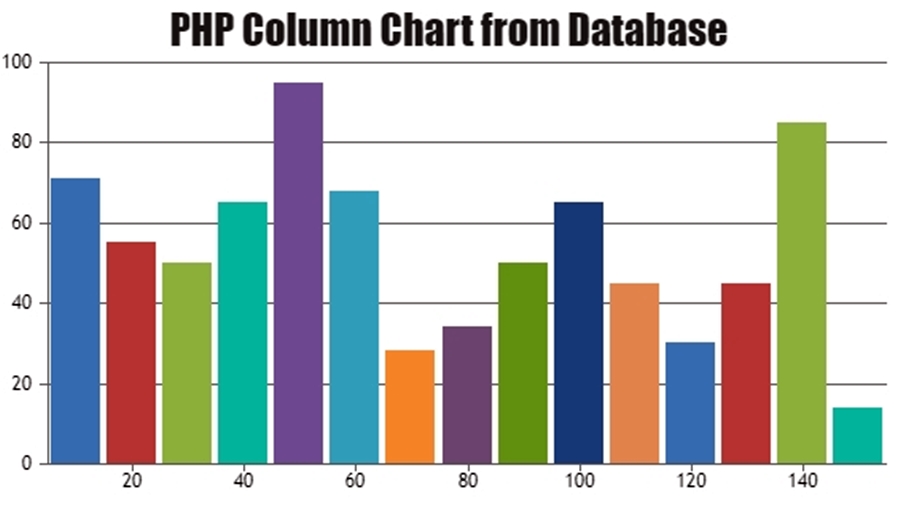
To update the same with the data from the database, you need to read data from database & return it from PHP (service.php), parse it to the format accepted by CanvasJS & render the chart. Please find the code-snippet below.
var updateChart = function() {
	$.getJSON("service.php", function(result) {
		dps.splice(0, dps.length);
		$.each(result, function(index, value) {
			dps.push(value);
		});
	});

	chart.render();
};

setInterval(function() {
	updateChart()
}, updateInterval);
Please take a look at this sample project for complete working code.
Also refer to this forum thread and PHP Gallery Page for more examples along with working code. You can also download PHP sample that you can run locally from our download page.

—
Vishwas R
Team CanvasJS
