Arjun,
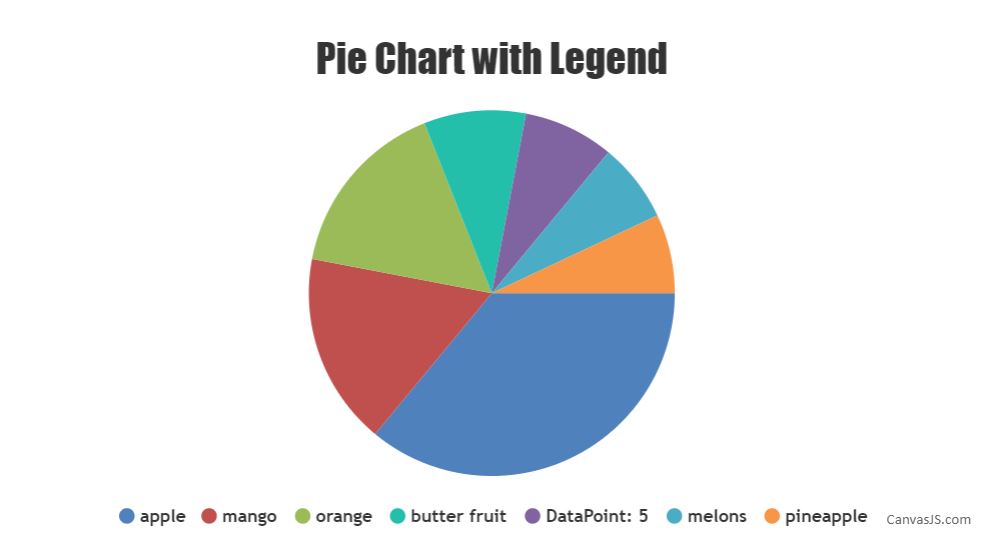
Here is an example for pie/doughnut charts without indexLabels. If your requirement is not to show legends, you can set showInLegend to false (defaults to false),if you have set it to true. Please check out the code-snippet below.
 data: [
    {
      type: "pie",
      showInLegend: true,
      toolTipContent: "{legendText}",
      dataPoints: [
        {  y: 36, legendText: "apple" },
        {  y: 17, legendText: "mango" },
        {  y: 16, legendText: "orange" },
        {  y: 9, legendText: "butter fruit" },
        {  y: 8, legnedText: "grapes" },
        {  y: 7, legendText: "melons" },
        {  y: 7, legendText: "pineapple"}

      ]
    }
  ]
If this doesn’t fulfill your requirement, pictorial representation would help us to understand and help you out.
—
Vishwas R
Team CanvasJS
.