Home Forums Chart Support How to put the YAxis lines in a row?

How to put the YAxis lines in a row?

Viewing 3 posts - 1 through 3 (of 3 total)
  • #32883

    Hello.

    I use canvasJS.

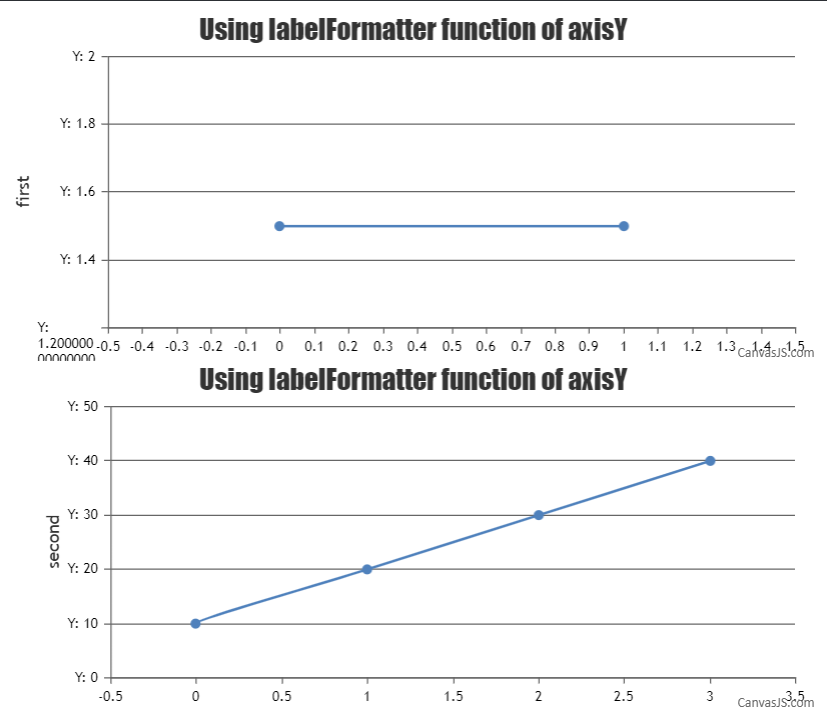
    I wonder how to put the two YAxis in a row.

    I think it’s not possible.

    Because, axis option has only ‘labelMaxWidth’.

    If there is ‘labelWidth’, maybe it works.

    But if width of label doesn’t leach the ‘labelMaxWidth’, width of label set smaller than labelMaxWidth.

    So could you tell me how to put two YAxis in a row?

    I mean this.
    |
    |

    Not
     |
    |

    Thank you.

    #32884

    ah… here is an example.

    https://jsfiddle.net/d5uovxtw/9/

    #32893

    @jeonkook,

    Aligning y-axis for multiple charts can be achieved by setting the margin property. The margin value has to be calculated based on the bounds of y-axis as shown in the code below –

    for(var i = 1; i < charts.length; i++) {
      charts[i].axisY[0].set("margin", charts[0].axisY[0].bounds.x2 - (charts[i].axisY[0].bounds.x2 - charts[i].axisY[0].bounds.x1));
    }

    Also, kindly take a look at this updated JSFiddle with the code to align the y-axis for multiple charts.

    align y-axis of multiple charts

    ___________
    Indranil Deo
    Team CanvasJS

Viewing 3 posts - 1 through 3 (of 3 total)

You must be logged in to reply to this topic.