manoj kumar,
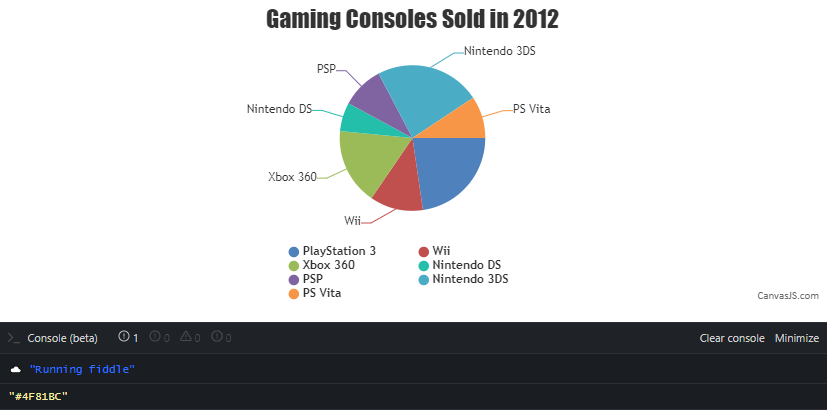
You can get the color of legend by using selectedColorset property of chart and index of dataPoint as shown in the code snippet below
indexLabelFormatter: function (e) {
  var dpIndex = getDataPointIndex(e.dataSeries, e.dataPoint);
  var selectedColorSet = chart.get("selectedColorSet");
  var legendColor = e.dataPoint.legendMarkerColor ? e.dataPoint.legendMarkerColor : (e.dataPoint.color ? e.dataPoint.color : selectedColorSet[dpIndex % (selectedColorSet.length-1)]);
  console.log(legendColor);
}
.
.
.
function getDataPointIndex(dataSeries, dataPoint) {
  return dataSeries.dataPoints.findIndex(dp => dp === dataPoint);
}
Also, please take at this updated JSFiddle for complete working code.

—-
Manoj Mohan
Team CanvasJS
