Home Forums Chart Support how to correct use timestamps in range?

how to correct use timestamps in range?

Viewing 2 posts - 1 through 2 (of 2 total)
  • #60086

    https://jsfiddle.net/obmd9wsh/

    i see only inegers on chart

    window.onload = function () {

    var chart = new CanvasJS.Chart(“chartContainer”, {
    title: {
    text: “titletitletitle”
    },
    axisX: {
    title: “some x title”,
    interval: 10
    },
    axisY: {
    title: “some YY title”,
    valueFormatString: “YYYY-MM-DD”
    },
    data: [{
    type: “rangeBar”,
    showInLegend: true,
    indexLabel: “{y[#index]}”,
    yValueType: “dateTime”,
    dataPoints: [
    { x: 10, y:[1088620200000, 1104517800000], label: “Sor” },
    { x: 20, y:[1112293800000, 1136053800000], label: “Qu” }
    ]
    }]
    });
    chart.render();
    }
    #60158

    asbuka,

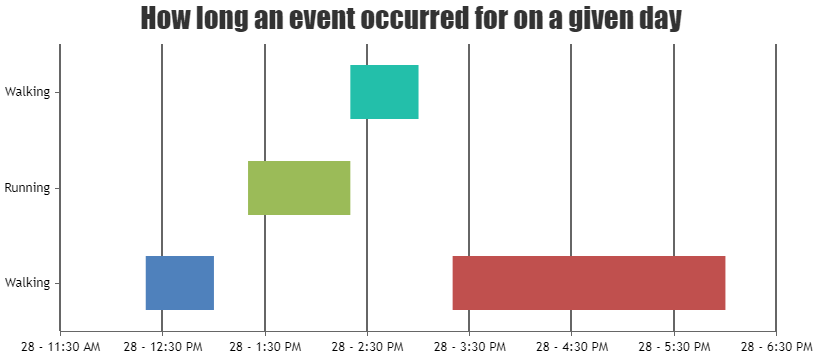
    Date-time values over y axis is not supported as of now. However, formatting the timestamp values to show it as date-time using labelFormatter should work fine in this case. Please take a look at this JSFiddle for a working example of the same.

    Gantt Chart using RangeBar chart

    Please refer to this article for more information about creating Gantt Charts.


    Ananya Deka
    Team CanvasJS

Viewing 2 posts - 1 through 2 (of 2 total)

You must be logged in to reply to this topic.