Home Forums Chart Support How to add dynamic multiple line in Y axis

How to add dynamic multiple line in Y axis

Viewing 4 posts - 1 through 4 (of 4 total)
  • #21175

    How to add dynamic multiple lines in Y axis with the shift point

    #21181

    @govind,

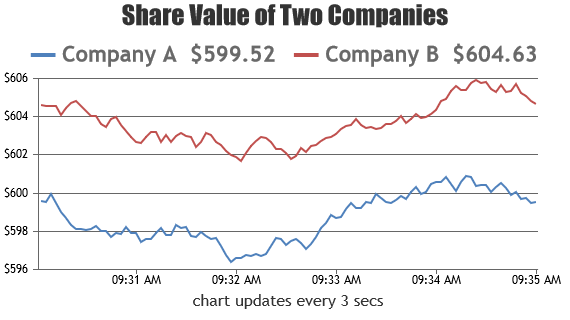
    Please take a look at this Gallery Page for an example on rendering dynamic multi-series line chart.
    JavaScript Dynamic Multi-Series Line Chart

    You can remove the extra dataPoints once the length of dataPoints reaches a threshold value with the help of shift method. Please refer to this documentation page for steep-to-step tutorial on Creating Dynamics Charts.


    Vishwas R
    Team CanvasJS

    #21196

    already we added 4 line in a line graph. when json file adds another point then display line of that point in a line graph.

    how to add dynamic data series. is any demo example?

    #21197

    @govind,

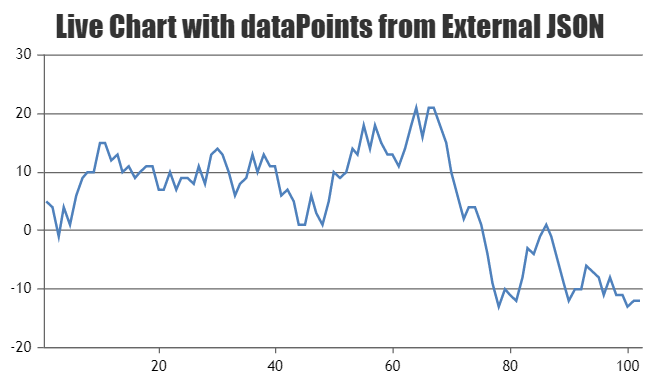
    Please refer this tutorial for step-to-step guide on rendering Live Updating Charts from JSON API & AJAX.
    Dynamic Chart with data from JSON


    Vishwas R
    Team CanvasJS

Viewing 4 posts - 1 through 4 (of 4 total)

You must be logged in to reply to this topic.