Login to Ask a Question or Reply
You must be logged in to post your query.
Home › Forums › Chart Support › Float y axis labels on top of scrolling chart
Float y axis labels on top of scrolling chart
- This topic has 18 replies, 2 voices, and was last updated 11 months, 1 week ago by
dpanscik.
-
March 6, 2025 at 9:22 am #60647
Does anyone have a jsfiddle that is bare bones that can show me how to float x axis labels on top of a very wide scrolling chart? The goal is to have x axis lables that stay in place when a very wide chart is scrolled horizontally.
I tried to figure out how this example works but there is to much going on for me to see clearly how this concept functions.
https://jsfiddle.net/svc51ym8/Thanks for the help!
March 6, 2025 at 6:32 pm #60654To make the y-axis stationery, you can position an overlayed canvas on top of the stockchart and copy the y-axis onto the overlayed canvas.
Please check this StackBlitz for a working example.
—
Manoj Mohan
Team CanvasJSMarch 6, 2025 at 9:47 pm #60655Thanks Manoj,
Why do you define
dataPoints2 = [];is it used somewhere that is not visible in this example?March 6, 2025 at 11:29 pm #60656I tried to drop the necessary code into a existing javascript canvas.js project and I am getting an error.
TypeError: Cannot read properties of undefined (reading ‘0’)
I believe this section is throwing an error. Have you seen this before?
`
var axisWidth =
stockChart.charts[0].axisY[0].bounds.x2 +
stockChart.charts[0].axisY[0].get(‘tickLength’);
var axisHeight =
stockChart.charts[0].height –
stockChart.charts[0].axisY[0].bounds.y1;
`March 7, 2025 at 9:06 am #60657Here is a fiddle. https://jsfiddle.net/canvasjs/QwZuf/
March 7, 2025 at 5:28 pm #60660Why do you define dataPoints2 = []; is it used somewhere that is not visible in this example?
Thanks for the feedback. We have updated the sample project.
I tried to drop the necessary code into a existing javascript canvas.js project and I am getting an error.
Can you kindly create a JSFiddle reproducing the issue you are facing & share it with us so that we can look into the code / chart-options being used, understand the scenario better and help you out?
—-
Manoj Mohan
Team CanvasJSMarch 10, 2025 at 9:42 am #60661@Manoj Mohan
Oops. The previous fiddle I created for you did not autosave.
Here is a fiddle that shows the issue I am having. The overlay canvas image is never created.
March 10, 2025 at 6:33 pm #60672The StackBlitz sample shared above uses CanvasJS StockChart not Chart. Error was being thrown as you were trying to access axisX & axisY as stockchart.charts[0].axisX instead of accessing them directly as stockChart.axisX. Also, we need to consider x-axis bounds instead of y-axis for fixing the axis as you are using Bar chart which has axisX as vertical and axisY as horizontal axis.
Please take a look at this updated JSFiddle for complete working code.
—-
Manoj Mohan
Team CanvasJSMarch 11, 2025 at 2:45 am #60674I had forgotten that bar charts have X & Y reversed.
Thank you for the assistance!
March 11, 2025 at 9:13 am #60675This seems to work in fiddle but in visual studio, I get the following error;
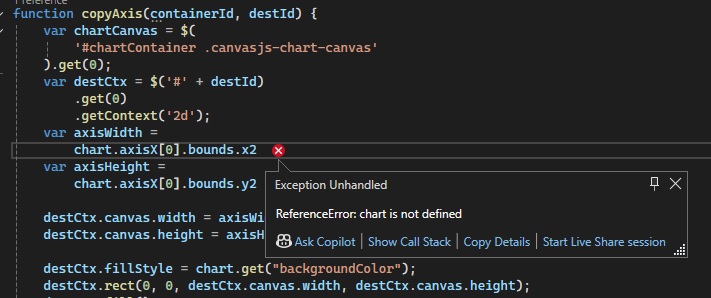 March 11, 2025 at 6:07 pm #60679
It seems like you are using a different variable name for chart object. Replacing it with the proper variable name should work fine in your case.
If you are still facing the issue, kindly create a JSFiddle reproducing the issue you are facing and share it with us so that we can reproduce the issue at our end, understand the scenario better and help you out.
—-
Manoj Mohan
Team CanvasJSMarch 12, 2025 at 9:14 am #60680Hi Manoj,
Here is a fiddle showing the code that I am using.
https://jsfiddle.net/sqvgocez/
The error (chartname) is not defined.
The error is at; (chartname).axisX[0].bounds.x2
Thank you for having a look at this.
Much appreciated.March 12, 2025 at 10:06 am #60682Updating all the occurrence of chart object’s variables names in the example should work fine in your case. Please take a look at this updated JSFiddle where chart object is passed as an argument to
copyAxisfunction.—-
Manoj Mohan
Team CanvasJSMarch 14, 2025 at 10:42 am #60688Hi Manoj,
Now I am getting an error TypeError: Cannot read properties of undefined (reading ‘getContext’)
`
var destCtx = $(‘#’ + destId)
.get(0)
.getContext(‘2d’);
`The error is on line 53 of the fiddle.
Here is a fiddle that helps to replicate this error.
https://jsfiddle.net/c5stbx86/1/March 17, 2025 at 6:41 pm #60725It seems like you’re assigning the same ID to both the chart container and its wrapper. This is likely causing the overlayed canvas (added for the axis) to be removed. Replacing it with a unique ID should resolve this issue. Additionally, you need to call the
copyAxisfunction when the window is resized or when scrolling occurs. Since you’re using Split.js, which doesn’t trigger an event on resizing the div blocks, there might be an issue with the positioning of the axis element. Please take a look at this updated JSFiddle for complete code.—-
Manoj Mohan
Team CanvasJS
You must be logged in to reply to this topic.