Login to Ask a Question or Reply
You must be logged in to post your query.
Home › Forums › Chart Support › export graph and its data into excel
export graph and its data into excel
- This topic has 7 replies, 4 voices, and was last updated 4 years, 5 months ago by
Vishwas R.
-
October 19, 2018 at 9:22 am #23121
hi, how to export graph and its data into excel.
I have tried to export it but it only download the graph.
here is my code
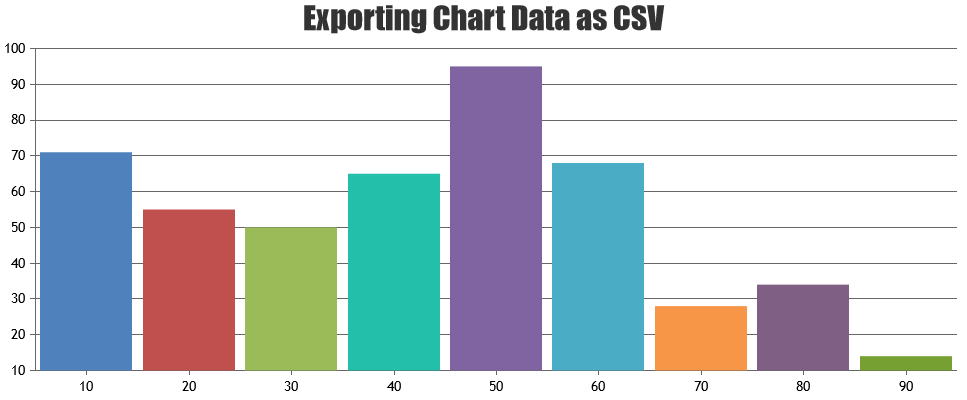
https://drive.google.com/open?id=1qW0D_QQk-LEck1Zdb0fp1xJfSVBDTlvROctober 22, 2018 at 10:04 am #23134Exporting chart data as excel / CSV is not available as an inbuilt feature as of now. However with few lines of code, you can convert chart data into comma-separated CSV and download it. Please find the code snippet for the same below.
function convertChartDataToCSV(args) {
  var result, ctr, keys, columnDelimiter, lineDelimiter, data;

  data = args.data || null;
  if (data == null || !data.length) {
    return null;
  }

  columnDelimiter = args.columnDelimiter || ',';
  lineDelimiter = args.lineDelimiter || '\n';

  keys = Object.keys(data[0]);

  result = '';
  result += keys.join(columnDelimiter);
  result += lineDelimiter;

  data.forEach(function(item) {
    ctr = 0;
    keys.forEach(function(key) {
      if (ctr > 0) result += columnDelimiter;
      result += item[key];
      ctr++;
    });
    result += lineDelimiter;
  });
  return result;
}
Please take a look at this JSFiddle for fully functional example on exporting chart data as CSV. Also take a look at this plugin, which does the same.

If this doesn’t help you, kindly share working sample project along with sample database over Google-Drive or Onedrive so that we can try running it locally, understand your scenario better and help you out.
—
Vishwas R
Team CanvasJSAugust 12, 2021 at 11:20 pm #35106Is it possible to export CSV data for multi series graph? I have 3 different datapoints in my graph and would like to export all 3 different y-axis values
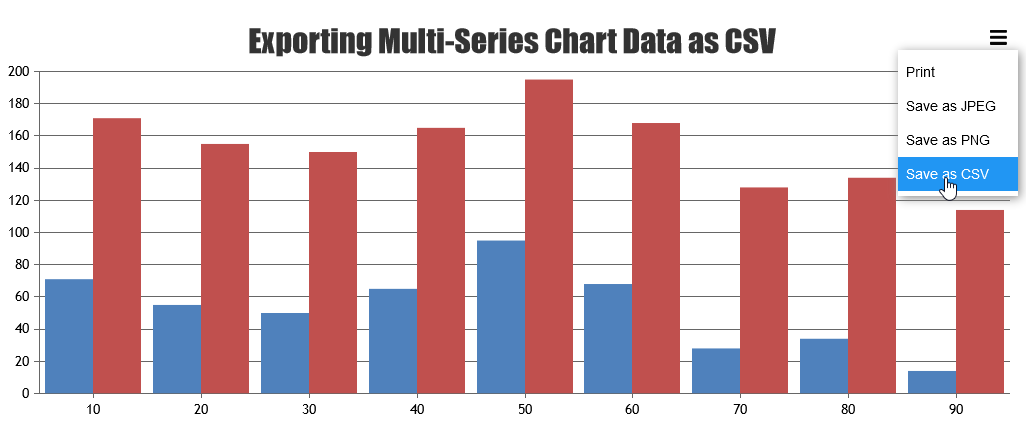
August 16, 2021 at 6:37 pm #35174Previously shared solution seems to be working only for single-series & not for multi-series. The code provided in the previously shared solution can be further improved to make it work with multi-series chart as shown in below code-snippet.
function convertChartDataToCSV(args) {
  var result = '',
      ctr, keys, columnDelimiter, lineDelimiter, data;

  data = args.data || null;
  if (data == null || !data.length) {
    return null;
  }

  columnDelimiter = args.columnDelimiter || ',';
  lineDelimiter = args.lineDelimiter || '\n';

  var mergedData = mergeData(data);

  keys = Object.keys(mergedData[0]);
  result = '';
  result += keys.join(columnDelimiter);
  result += lineDelimiter;

  mergedData.forEach(function (item) {
    ctr = 0;
    keys.forEach(function (key) {
      if (ctr > 0) result += columnDelimiter;
      result += (typeof (item[key]) != undefined ? item[key] : "");
      ctr++;
    });
    result += lineDelimiter;
  });
  return result;
}
Please take a look at this JSFiddle for working code. Also take a look at this external plugin, which has been updated to work with multi-series chart.
—
Vishwas R
Team CanvasJSSeptember 2, 2021 at 9:56 pm #35603Hi Vishwas.
I tried to run the code on JSFiddle, but only works once.
And the last Data with all DataPoints is deleted.Do you know if this code works on Canjas 3.4 version ?
September 3, 2021 at 6:32 pm #35612Thanks for reporting the use-case. There was a minor issue with the object reference in the external code added for exporting the chart data as CSV. We have updated the same, please take a look at updated JSFiddle.

—
Vishwas R
Team CanvasJSSeptember 3, 2021 at 10:18 pm #35616Hi Vishwas.
Now the code on JSFiddle works fine, thanks.
Another question:
Can I use this code on CanvasJs Trial version?-
This reply was modified 4 years, 5 months ago by
Daniel_Peixoto.
September 6, 2021 at 6:16 pm #35633The code will work with trial version – which is fully-featured & can be used to evaluate for upto 30 days. You can check out license page for license-related queries or contact sales@canvasjs.com.
—
Vishwas R
Team CanvasJS -
This reply was modified 4 years, 5 months ago by
You must be logged in to reply to this topic.