Login to Ask a Question or Reply
You must be logged in to post your query.
Home › Forums › Chart Support › Dynamic Chart php did not send data to $.getJSON() using PHP,MYSQL,CanvasJS
Dynamic Chart php did not send data to $.getJSON() using PHP,MYSQL,CanvasJS
- This topic has 4 replies, 2 voices, and was last updated 8 years, 1 month ago by
Indranil.
-
January 8, 2018 at 12:18 am #18602
Hello,
I want to make dynamic chart input given by user send to ajax function drawgraph().Ajax function send data to php,and php send data to $.getJSON(“myphpService.php”, function(result).Its did not show anything-
This topic was modified 8 years, 1 month ago by
Sajjad Mustafa.
-
This topic was modified 8 years, 1 month ago by
Sajjad Mustafa.
January 8, 2018 at 9:37 am #18605Can you please check your Browser Console for any errors? Also, can you please create a sample project and share your code, so that we can look into it and help you out.
___________
Indranil Deo,
Team CanvasJSJanuary 8, 2018 at 10:27 am #18606Browser did no show any error and how i can share my code here.
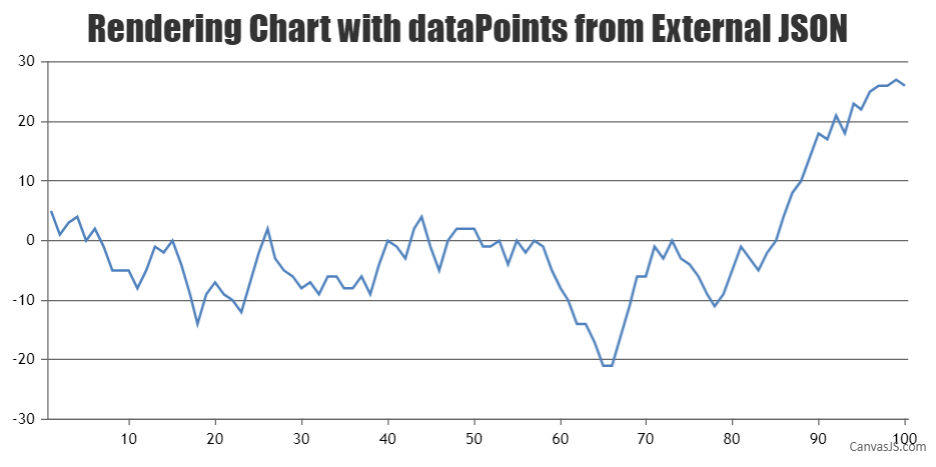
January 8, 2018 at 10:32 am #18609<----------------------------DrawGraph.html--------------------> <html> <head> <title></title> </head> <body> <div class="container-fluid"> <p>IN container </p> <div id="chartContainer" style="height: 370px; max-width: 920px; margin: 0px auto;"></div> </div> </div> <input type="date" name="gsdate" id="gsdate"></div> <input type="date" name="gedate" id="gedate"></div> <select name="gitem" id="gitem"> <option value="">Select item</option> <option value="SetPoint">Set Point</option> <option value="SupplyWater">Supply Water</option> </select> <select name="gAHU" id="gAHU"> <option value="">Select AHU</option> <option value="AHU 1-1">AHU 1-1</option> <option value="AHU 1-2">AHU 1-2</option> <option value="AHU 2-1">AHU 2-1</option> <option value="AHU 2-2">AHU 2-2</option> </select> <button type="button" id="run" onclick="drawgraph()">Draw Graph</button> <script type="text/javascript" src="https://canvasjs.com/assets/script/jquery-1.11.1.min.js"></script> <script type="text/javascript" src="https://cdn.canvasjs.com/jquery.canvasjs.min.js"></script> <script type="text/javascript"> function drawgraph() { var gsdate = $("#gsdate").val(); var gedate = $("#gedate").val(); var gAHU = $("#gAHU").val(); var gitem = $('#gitem').val(); DataArray = { "gsdate" : gsdate, "gedate" : gedate, "gAHU" : gAHU , "gitem" : gitem } $.ajax({ type:"POST", url : "myphpService.php", data : DataArray, datatype : 'html', }).done(function(data,Status) { $("#gmessage").html(data); }) } $.getJSON("myphpService.php", function(result) { var dps= []; for(var i=0; i<result.length;i++) { dps.push({ "label":result[i].year, "y":[result[i].minivalue,result[i].maxivalue] }); } var chart = new CanvasJS.Chart("chartContainer", { animationEnabled:true, title: { text: "BMS Performance Monitroing", }, axisX: { title: "Date", }, axisY: { title: "Range", }, data: [{ type: "rangeColumn", dataPoints: dps }] }); chart.render(); }); </script> </body> </html>January 9, 2018 at 10:07 am #18614Please take a look at Rendering Charts from JSON API using AJAX for step to step instruction on rendering chart from JSON data. Also, kindly check this gallery example for chart from JSON data in PHP. Could you please provide the sample JSON data returned from myphpService.php so that we can look into the data and help you out?

___________
Indranil Deo
Team CanvasJS -
This topic was modified 8 years, 1 month ago by
You must be logged in to reply to this topic.