Home Forums Chart Support Drag and resize charts in react

Drag and resize charts in react

Viewing 4 posts - 1 through 4 (of 4 total)
  • #24519

    Hi,
    Recently i am creating a react website and i am using canvas js charts and i want to add a dragable component to this charts to resize and rescale with mouse-drag.
    Tnx ;)

    #24556

    @ramtin_vedved,

    Can you please let us know which specific component of the chart you would like to be draggable such as dataPoints, chart container(div) etc. so that we can understand your exact use case and help you out with an appropriate solution.

    ____
    Shashi Ranjan
    Team CanvasJS

    #25034

    Hi Team,

    I want to achieve Drag data points in line and Bar chart in React Canvas JS.
    I have used the code mentioned here : https://canvasjs.com/docs/charts/how-to/make-data-points-on-chart-draggable/
    However i am facing difficulties in achieving this, Could you guide me or post a code which can be done the same.

    #25043

    @tilakbhanugmail-com,

    To create a chart with draggable dataPoints you can attach event handlers to div with id "canvasjs-react-chart-container-0" in React so as to perform necessary actions when user clicks or drags inside the div as shown in the code snippet below:

    $("#canvasjs-react-chart-container-0 > .canvasjs-chart-container").on({
      mousedown: function(e) {
        _this.mouseDown = true;
        _this.getPosition(e);  
        _this.searchDataPoint();
      },
      mousemove: function(e) {
        _this.getPosition(e);
        if(_this.mouseDown) {
          clearTimeout(_this.timerId);
          _this.timerId = setTimeout(function(){
            if(_this.selected != null) {
              chart.data[0].dataPoints[_this.selected].y = _this.yValue;
              chart.render();
            }   
          }, 0);
        }
        else {
          _this.searchDataPoint();
          if(_this.changeCursor) {
            chart.data[0].set("cursor", "n-resize");
          } else {
            chart.data[0].set("cursor", "default");
          }
        }
      },
      mouseup: function(e) {
        if(_this.selected != null) {
          chart.data[0].dataPoints[_this.selected].y = _this.yValue;
          chart.render();
          _this.mouseDown = false;
        }
      }
    });

    Please take a look at this Sample Project for a working example with sample code.

    Considering this as duplicate of React CanvasJS: Drag Data Points and closing the thread.
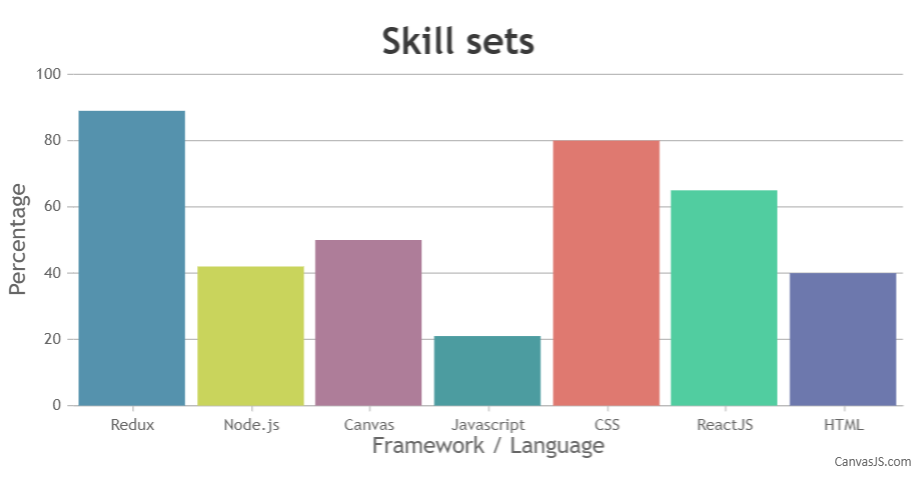
    CanvasJS chart with draggable dataPoints in React


    Vishwas R
    Team CanvasJS

Viewing 4 posts - 1 through 4 (of 4 total)

You must be logged in to reply to this topic.