Home Forums Chart Support Doughnut Chart with Center Label

Doughnut Chart with Center Label

Viewing 5 posts - 1 through 5 (of 5 total)
  • #29846

    Hello,

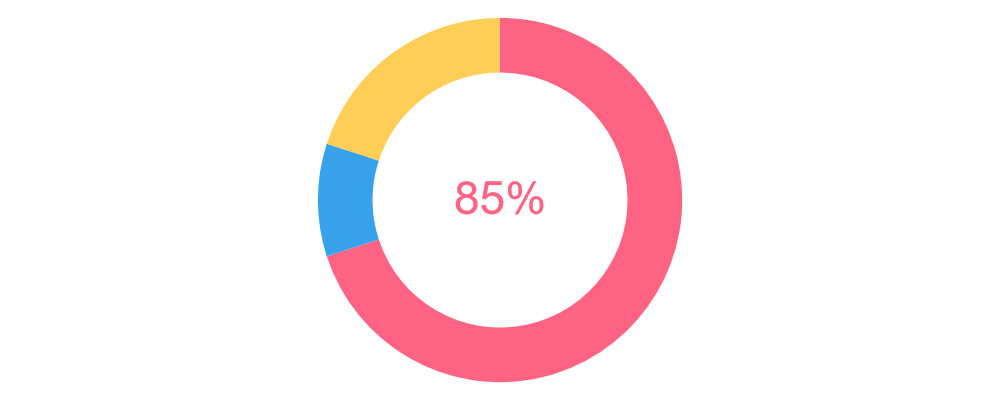
    I am trying to develop a series of doughnut charts that will show a Label in the center of the Doughnut Chart’s hole. Any advice on how I can achieve this? Here’s an example for what I am trying to develop.

    Basic Structure of what I'm trying to achieve

    #29854

    @afreay,

    You can position chart title in the center of doughnut by setting verticalAlign property to center. Please take a look at this JSFiddle for the same.

    ___________
    Indranil Deo
    Team CanvasJS

    #44619

    Hello, this is what I want, but it is a little different, but the first time it is loaded, the number in the middle will count the total of how many slice percentages there are, for example 85%, that is, a simple counter.
    Also, whichever language I click on, it will show the name of the language I clicked on in the middle, can this be possible thanks

    #44627

    @codetonight,

    You can update the chart title dynamically to reflect the name of the selected datapoint upon clicking. Please find the code-snippet below:

    click: function(e) {
      e.chart.title.set("text", e.dataPoint.name);
    }

    Please take a look a this JSFiddle for an example of the same.

    Doughnut Chart with Title in the Center


    Vishwas R
    Team CanvasJS

    #44641

    thank you

Viewing 5 posts - 1 through 5 (of 5 total)

You must be logged in to reply to this topic.