Home Forums Chart Support Display string beside the y axis tool tip value

Display string beside the y axis tool tip value

Viewing 5 posts - 1 through 5 (of 5 total)
  • #36097

    Dear friends,
    I have a standard series of time as x values, and their corresponding values as y axis like this :

    dataPoints: [
            { x: new Date(2021,10,20), y: 1 },
            { x: new Date(2021,10,21), y: 3 },
    	{ x: new Date(2021,10,22), y: 2 },
              ...
                ]

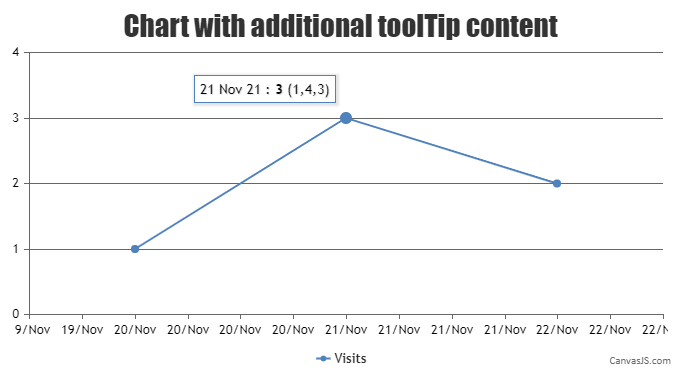
    Now I’d like to add different string like (2,3) to each y Tool Tip value, like this :

    22 Oct 20 : 1 (5)
    22 Oct 21 : 3 (1,4,3)
    22 Oct 22 : 2 (2,3)

    Is this possible ?

    #36101

    @htarahi,

    It is possible to add some extra content to the toolTip using contentFormatter property as shown in the code-snippet below,

     contentFormatter: function (e) {
          var content = " ";
          for (var i = 0; i < e.entries.length; i++) {
            content += CanvasJS.formatDate(e.entries[i].dataPoint.x, "DD MMM YY") + " : " + "<strong>" + e.entries[i].dataPoint.y + "</strong>" + " " + e.entries[i].dataPoint.extraContent;
            content += "<br/>";
          }
      return content;
    } 

    Kindly take a look at this JSFiddle for an example on rendering a chart with additional content on the toolTip.

    chart with additional tooltip content


    Adithya Menon
    Team CanvasJS

    #36102

    Exactly what I wanted, Thanks.
    Now I have another Question,
    How can I do the same, if I have multi chart with data like this ?

    data: [{
            name: "Error",
            type: "area",
            legendMarkerType: "triangle",
            axisYIndex: 0, //defaults to 0
            color: "#B61919",
            showInLegend: true,
            dataPoints: obj
        },{
            name: "WARNING",
            type: "line",
            legendMarkerType: "circle",
            axisYIndex: 1,
            color: "#f6a603",
            showInLegend: true,
            dataPoints : obj2
        },{
            name: "SIGNAL",
            type: "area",
            legendMarkerType: "cross",
            axisYIndex: 2,
            markerSize: 0,
            color: "purple",
            showInLegend: true,
            dataPoints : obj3
        }
    ]
    #36122

    @htarahi,

    It is possible to use contentFormatter property to add some extra content to the toolTip on multi-series chart as well.

    Kindly take a look at this updated JSFiddle for an example on rendering a multi-series chart with additional content on the toolTip.


    Adithya Menon
    Team CanvasJS

    #36174

    Thank you very much, that was exactly what I wanted.

Viewing 5 posts - 1 through 5 (of 5 total)

You must be logged in to reply to this topic.