Home Forums Chart Support Display only integer values for ticks

Display only integer values for ticks

Viewing 5 posts - 1 through 5 (of 5 total)
  • #20600

    Hi,
    Is it possible to display only integer value on the axis?
    So for instance we have next data points

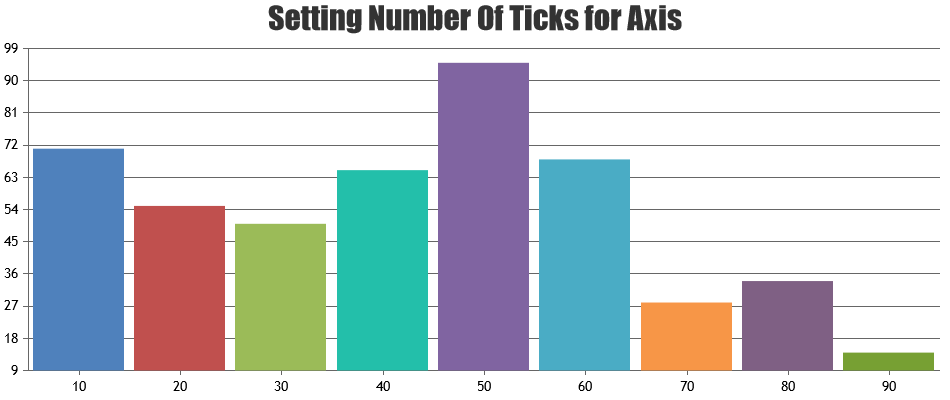
            dataPoints: [
            { y: 71, x: 1},
            { y: 55, x: 2},
            { y: 50, x: 3},
            { y: 65, x: 4},
            { y: 95, x: 5},
            { y: 68, x: 6},
            { y: 28, x: 7},
            { y: 34, x: 8},
            { y: 14, x: 9}
            ]
          }

    and when we try to zoom our then chart starts display float values for ticks, like 3, 3.5, 4, etc. but we need to have just 3, 4, 5…

    Please, see an example: https://jsfiddle.net/tn2u0650/18/

    Thanks

    • This topic was modified 6 years, 7 months ago by psergey.
    #20602

    @psergey,

    You can set interval to 1 to avoid showing values between the dataPoint x-values. Please take a look at this updated JSFiddle. Alternately, you can also use labels instead of x to do the same as shown in this JSFiddle.

    Labels & Index Labels in Chart


    Vishwas R
    Team CanvasJS

    #20604

    Hi @vishwas,

    Thank you for your answer.

    #20704

    Hi @vishwas,

    We faced out with a problem of displaying integer values for multi-series chart
    1) If series start not from the same data-point position and use label approach you suggested, then label displays not correctly
    https://jsfiddle.net/tn2u0650/32/
    but if adds empty elements as stub for missing points then chart looks good https://jsfiddle.net/tn2u0650/31/

    2) If set interval to 1 then chart looks bad for big range, for instance if we have 800 items than all range from 1 till 800 will be displayed on X-asix

    Any suggestion, or we need to go with #1

    Thanks

    #20709

    @psergey,

    1) If series start not from the same data-point position and use label approach you suggested, then label displays not correctly
    https://jsfiddle.net/tn2u0650/32/ but if adds empty elements as stub for missing points then chart looks good https://jsfiddle.net/tn2u0650/31/

    You can use x-value along with labels to align all data-points based on x-values properly. Please take a look at this updated JSFiddle.

    2) If set interval to 1 then chart looks bad for big range, for instance if we have 800 items than all range from 1 till 800 will be displayed on X-asix

    Calculation of axis interval depends on various factors like axis-minimum, axis-maximum, number of labels that can be shown within that range of axis, length of axis etc. When you set interval to a value, it doesn’t auto-calculate instead accepts the value that you have assigned irrespective of range, number of data-points and length of axis. You can either remove hard-coded interval so that it will be auto-calculated or you can calculate based on range, number of ticks as shown in this JSFiddle.
    customizing number of ticks labels in axis


    Vishwas R
    Team CanvasJS

Viewing 5 posts - 1 through 5 (of 5 total)

You must be logged in to reply to this topic.