Home Forums Chart Support Creating waterfall chart by selecting point in linechart

Creating waterfall chart by selecting point in linechart

Viewing 3 posts - 1 through 3 (of 3 total)
  • #36874

    WR

    Dear Team

    I have a linechart with 28 different lines. It
    On the x-axis I have values per Hour.

    I’d like to click a datapoint which belongs to an hour or select one hour and make a waterfall chart for specified hour by taking all points from the hour
    How can it be done?

    with kind regards,

    Ron

    #36877

    WR

    found it:

    i used some funcions to complete:

    1 the clickfeature
    * chart1.options.data[0].dataPoints.push({x: value[0], y: value[1], click: onClick });
    2 emptying dataseries
    * chart3.options.data[0].dataPoints = [];
    3 filling datapoints like
    * chart3.options.data[0].dataPoints.push({label: “Year” , y: chart1.options.data[0].dataPoints[e.dataPointIndex].y });

    #36889

    @kerrith,

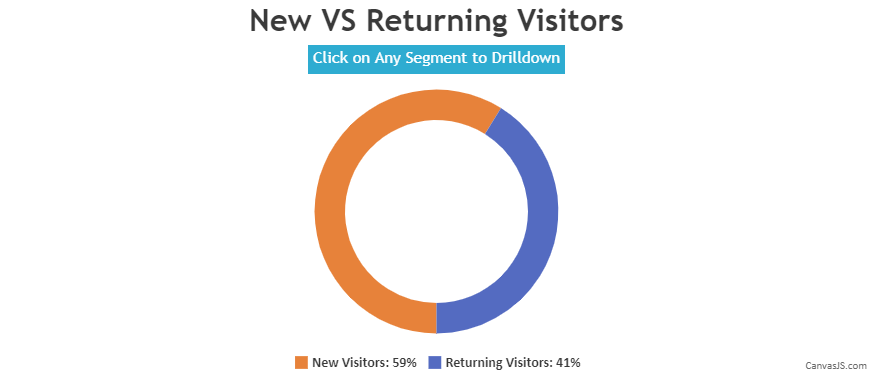
    You can create a drilldown chart to achieve your requirement. Please take a look at this gallery page for an example on the same.

    Drilldown Chart


    Thangaraj Raman
    Team CanvasJS

Viewing 3 posts - 1 through 3 (of 3 total)

You must be logged in to reply to this topic.